Research - (2021) Volume 9, Issue 6
Study of Pulmonary Tuberculosis in Diabetes Patients
Nair Shraddha, V Suryanarayana and Raja Amarnath G*
*Correspondence: Raja Amarnath G, Department of Pulmonary Medicine, Sree Balaji Medical College & Hospital Affiliated to Bharath Institute of Higher Education and Research, India, Email:
Abstract
Tuberculosis was recognized as an infectious disease. A prospective, randomized study was designed to compare the clinical and radiological presentation of pulmonary tuberculosis in DM and non DM cases. The present study focuses on to compare treatment outcomes of TB in DM and non DM cases. The present study compares the clinical presentation profile and outcomes of TB in diabetic and non-diabetic patients at a tertiary reference centre in Chennai.
Keywords
Tuberculosis, Diabetes mellitus, HIV/AIDS, Sputum, Chest X-ray
Introduction
TB prevailed among humans since antiquity, with the earliest evidence of TB dating back to 5800BC when TB was found in the skeleton of a 30-year-old woman in Italy. TB was also found in Egyptian mummies dating back to 1550 BC. Tuberculosis (TB) has existed for millennia and remains a major global health problem. It causes ill-health in millions of people each year and the year 2015, TB was one of the top 10 causes of death worldwide, ranking above Human Immunodeficiency Virus/ Acquired Immuno deficiency Syndrome (HIV/AIDS) as one of the leading causes of death from an infectious disease. This is despite the fact that with a correct treatment, most people who develop TB disease can be cured. According to the Global Tuberculosis Report 2016, the global incidence (number of cases occurring per year) of tuberculosis is 10.4 million. The incidence of TB case in India being 2.84 million with 480,000 deaths.
There are many predisposing factors for TB, which include HIV/ AI DS , silicosis, malnutrition and smoking etc. Incidence of tuberculosis is greatest amongst those with conditions impairing immunity 2' such as Diabetes. In India 18% of the patients with pulmonary tuberculosis have Diabetes 3.Diabetes mellitus (DM) 1s a well-known predisposing factor for tuberculosis (TB) since the ancient times [1-5]. While the link with Diabetes and TB has been known since Roman times, it is only recently that unequivocal evidence has been gathered to show a strong association between the two diseases. At present, India is facing a dual epidemic of diabetes and tuberculosis (TB) [6]. Due to the epidemic-like spreading and severe complications, diabetes is considered one of the most prominent chronic conditions globally. Succeeding the unhealthy lifestyle transitions in developing countries, the diabetes epidemic is now burdened by the infectious (or communicable) diseases [7]. In 2014, there were an estimated 65.1 million people worldwide with diabetes and the number is projected to rise to 109 million in 2035 [8]. Today it is estimated that 80% of all diabetes cases occur in low-and middle income countries. The association between the global diabetes epidemic and the high number of TB cases, particularly in South-east Asia and the Western Pacific, is a global public health concern. Considering that 75% of the total numbers of people with diabetes live in low- and middle income countries, it is of great concern that these same countries also struggle with high rates of TB.
The prevention and treatment of both TB and DM present major public health challenges in all settings across the globe. Given the rising incidence trends of both diseases it is particularly important to understand the association in detail within this setting so that any relevant information can be utilized to aid local TB and DM prevention and control. Any studies have been done in the past which recognizes the link between pulmonary tuberculosis and Diabetes Mellitus. With regards to the possible effects of DM on the presentation and treatment outcome of TB, recent data which are available have conflicting results. Due to the varied presentation of Tuberculosis in DM patients and lot of discrepancies in the literature, this field still needs to be explored.
Materials and Methods
The present Study of Pulmonary Tuberculosis in Diabetes patients", was conducted in the Department of Pulmonary Medicine, Sree Balaji Medical College and Hospital,
Chrompet, Chennai after obtaining the approval from the Institutional Human Ethical Committee.
Study design
Study design is a Prospective Cohort study.
Study period and duration
Study has been done from April 2015 to April 2016.
Place
The study was conducted in the Department of Pulmonary Medicine of Sree Balaji Medical College and Hospital, Chennai.
Source of data
All the newly diagnosed cases of sputum smear positive Pulmonary Tuberculosis with DM and without DM who visited Outpatient department and were admitted in the department of Pulmonary Medicine, Sree Balaji Medical College and Hospital during the study period are taken.
Sample size
A total of 68 smear positive Pulmonary TB patients are included in the study out of whom 32 patients are taken in DM group and 36 patients without DM group. All newly detected sputum positive Pulmonary Tuberculosis patients during our study period are selected and screened for DM (FBS, PPBS or HbAl C). They have been selected into the study after informed consent and fulfilling the inclusion and exclusion criteria listed below.
Inclusion criteria
• New Pulmonary TB, Smear positive cases confirmed by AFB in sputum smear.
• With coexistent Diabetes Mellitus, new or known case.
Exclusion criteria
• Other forms of Tuberculosis including smear negative Pulmonary Tuberculosis.
• Patients with HIV-TB coinfection.
• Patients with Systemic Hypertension, chronic renal failure, chronic liver disease or cardiovascular disease.
• Age <15 years.
• Patients on steroid therapy or any immunosuppressive therapy.
• Pregnant women.
• Past history of receiving Anti Tuberculosis Treatment.
• Patients with malignancy or receiving chemotherapy or radiotherapy
• Patients with connective tissue disorders.
• Patients with history of recent abdominal and cardio thoracic surgeries.
Method of collection of data
All the patients who visited hospital with symptoms suggestive of pulmonary TB like cough for 2 weeks or more with or without other symptoms were identified as pulmonary TB suspects and confirmed by sputum study of AFB.
All "New TB" cases diagnosed were then screened for diabetes mellitus. Patients were included if they were known diabetics and taking anti diabetic treatment or newly diagnosed DM, the criteria being: FBS more or equal to 126 mg/dL (7.0 mmol/L). Fasting is defined as no caloric intake for at least 8 hours* Or 2-h PPBS more or equal to 200 mg/dL (11.1 mmo l/L)durin g an OGTT. The test should be performed as described by the WHO, using a glucose load containing the equivalent of 75mg anhydrous glucose dissolved in water .Or HbA1C more of equal 6.5 % (48mmol/L). the test should be performed in a laboratory using a method that is NGSP and certified and standardized to the DCCT assay or In a patient with classic symptoms of hyperglycemia or hyperglycemic cns1s, a random plasma glucose more or equal to 200mg/dL (l 1.lmmol/L).* In the absence of unequivocal hyperglycemia, results should be confirmed by repeat testing.
An HbA1c of 6.5% is recommended as the cut off point for diagnosing diabetes. A value of less than 6.5% however does not exclude diabetes diagnosed using glucose tests". All the patients included in the study were subjected to a detailed evaluation of their personal information, present symptoms, past history of tuberculosis, smoking history, history of anti-tuberculosis treatment, history of diabetes and family history of diabetes. All the routine investigations, Chest X-ray posterior-anterior view, FBS, PPBS and HbAlc levels were done at the beginning of the study and follow up (end of 2,3,5 months and end of treatment). HbA 1c levels of the patients were measured using BIO-RAD D-10 haemoglobin testing system. Patients with HbA 1c level 2: 8% were said to have poor glycemic control. Physical examination was done and a clinical diagnosis was mad e. All the required investigations were done. Microscopic examination of Ziehl-Neelsen stained sputum slides were performed for acid-fast bacilli. Sputum smears are examined and interpreted as indicated in the table below (Table 1).
| If the slide has | No.of fields to be examined | Grading | Result |
|---|---|---|---|
| No AFB in 100 oil immersion fields | 100 | 0 | Neg |
| 1-9 AFB per 100 oil immersion fields | 100 | Scanty | Pos |
| 10-99 AFB per 100 oil immersion fields | 100 | 1 + | Pos |
| 1-10 AFB per oil immersion fields | 50 | 2+ | Pos |
| More than 10 AFB per oil immersion field | 20 | 3 + | Pos |
Table 1: Grading of sputum AFB.
The Chest radiographs were read independently by 2 experienced professionals and radiological lesions on chest X ray were classified into minimal, moderately advanced and far advanced as per American Thoracic Society criteria.
Minimal
Minimal lesions include those that are of slight to moderate density but which do not contain demonstrable cavitation. They may involve a small part of one or both lungs, but the total extent, regardless of distribution, should not exceed the volume of lung on one side that occupies the space above the second chondrosternal junction and the some of the fourth or the body of the fifth thoracic vertebra.
Moderately advanced
Moderately advanced lesions may be present in one or both lungs, but the total extent should not exceed the following limits: disseminated lesions of slight to moderate density that may extend throughout the total volume of one lung or the equivalent in both lungs; dense and confluent lesions limited in extent to one-third the volume of one lung; total diameter of cavitation, if present, must be less than 4cm.
Far advanced
Lesions more extensive than moderately advanced Lower lung field tuberculosis was defined as "tuberculosis disease found below an imaginary line traced across the hilar and including the parahilar regions on a standard posterior-anterior chest roentgenogram". The first infection with the tubercle bacillus is known as primary tuberculosis. The lesion at the primary site of involvement, draining lymphatics and inflamed regional lymph node constitute the primary complex. When the primary site of implantation is in the lung, it is called Ghon's focus. The draining lymphatics and the involved lymph nodes together with Ghon' s focus constitute the primary complex(Ghon complex). The subsequent course is determined by the immune status of the host. In order to cause an infection, the M. tuberculosis bacterium must first pass through the physical defences of the upper respiratory tract (URT) including those of the nose, nasal cavity, turbinates, and pharynx. Bacterium must avoid impingement, or expulsion by mucocilliary action or the cough and sneeze reflexes it to cause a diseased state.
Results
Data analysis
Descriptive statistics was done for all data and were reported in terms of mean values and percentages. Suitable statistical tests of comparison were done. Continuous variables were analyzed with the unpaired t test. Categorical variables were analyzed with the Chi- Square Test and Fisher Exact Test. Statistical significance was taken as P < 0.05. The data was analysed using SPSS version 16 and Microsoft Excel 2007. Table 2 shows the grouping of the patient.
| Groups | Definition | Number |
|---|---|---|
| PTB-DM | Pulmonary tuberculosis proven by sputum positivity with diabetes mellitus | 32 |
| PTB | Pulmonary tuberculosis proven by sputum positivity without diabetes mellitus | 36 |
Table 2: Grouping of patients.
By conventional criteria the association between the study groups and age distribution is considered to be statistically significant since p<0.05.In patients belonging to PTB-DM group, the mean age is 57.47 years with majority belonging to 41-60 years age group (n=25, 78.13%) followed by 61-80 years age group (n=7, 21.88%). In PTB group, the mean age is 39.81 years with majority belonging to 21-40 years age group (n=l7, 47.22%) followed by 41-60 years age group (n=14, 38.89%). The mean age was more in PTB-DM group compared to the PTB group by 31% with a mean difference of 17.66 years. The increased mean age 1i1 PTB-DM group compared to the PTB group is statistically significant as the p value is <0.0001 as per unpaired ttest indicating a true statistical difference between study groups (Table 3 and Figure 1) (Table 4 and Figure 2). By conventional criteria the association between the study groups and gender status is considered to be not statistically significant since p > 0.05.
| Age -Groups | PTB+DM | PTB | PTB+DM (%) | PTB (%) |
|---|---|---|---|---|
| 20 years | 0 | 1 | 0 | 2.78 |
| 21-40 years | 0 | 17 | 0 | 47.22 |
| 41-60 years | 25 | 14 | 78.13 | 38.89 |
| 61-80 years | 7 | 4 | 21.88 | 11.11 |
| Total | 32 | 36 | 100 | 100 |
Table 3: Age groups.
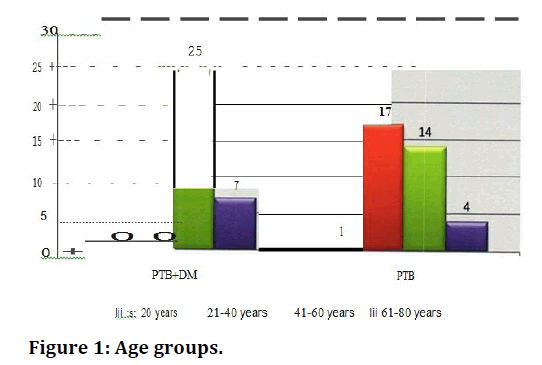
Figure 1. Age groups.
| Age Distribution | PTB+DM | PTB |
|---|---|---|
| Mean | 57.47 | 39.81 |
| SD | 6.19 | 11.16 |
| P Value Unpaired t Test | <0.0001 | |
Table 4: Age distribution.
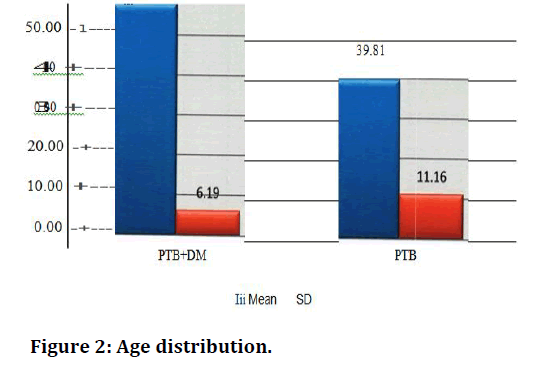
Figure 2. Age distribution.
The study population consists majority of males. In PTBDM males being (n=23, 71.88%) followed by females (n=9, 28.13%) and in PTB group also majority belonged to male gender (n=21, 58.33%) followed by female gender (n=15, 41.67%) (Table 5 and Figure 3).
| Gender Status | PTB+DM | PTB | PTB+DM (%) | PTB (%) |
|---|---|---|---|---|
| Male | 23 | 21 | 71.88 | 58.33 |
| Female | 9 | 15 | 28 .13 | 41.67 |
| Total | 32 | 36 | 100 | 100 |
| P Value Chi Squared Test | 0.2435 | |||
Table 5: Gender status.
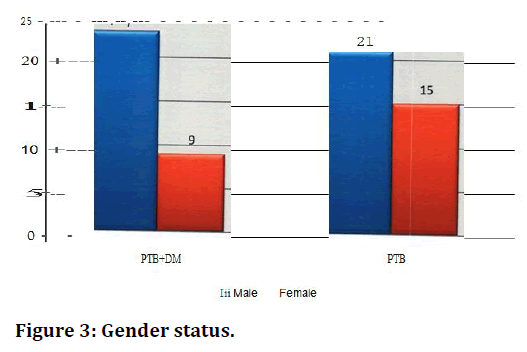
Figure 3. Gender status.
By conventional criteria the association between the study groups and BMI status is considered to be statistically significant since p<0.05. In patients belonging to PTB-DM group, majority belonged to overweight BMI group (n=20, 62.50%) followed by normal BMI group (n=l 1, 34.38%). In PTB group, majority belonged to normal BMI group (n=20, 55.56%) followed by underweight BMI group (n=16, 44.44%). The incidence of overweight BMI status is more in PTB-DM group compared to the PTB group by 38% with a percentage difference of 62.50 points. This is statistically significant as the p value is <0.0001 as per fishers exact test indicating a true statistical difference between study groups (Table 6 and Figure 4). By conventional criteria the association between the study groups and smoking status is not considered to be statistically significant. In patients belonging to PTB-DM group, majority are smokers (n=22, 68.75%) followed by non-smokers (n=9, 28.12%). In PTB group, similarly majority are smokers (n=21, 58.33%) followed by non-smokers (n=15,41.66%) (Table 7 and Figure 5).
| BMI Status | PTB+DM | PTB | PTB+DM (%) | PTB (%) |
|---|---|---|---|---|
| Underweight | 1 | 16 | 3.13 | 44.44 |
| Normal | 11 | 20 | 34.38 | 55.56 |
| Overweight | 20 | 0 | 62.5 | 0 |
| Obese | 0 | 0 | 0 | 0 |
| Total | 32 | 36 | 100 | 100 |
| P Value Fishers Exact Test | <0.0001 | |||
Table 6: BMI status.
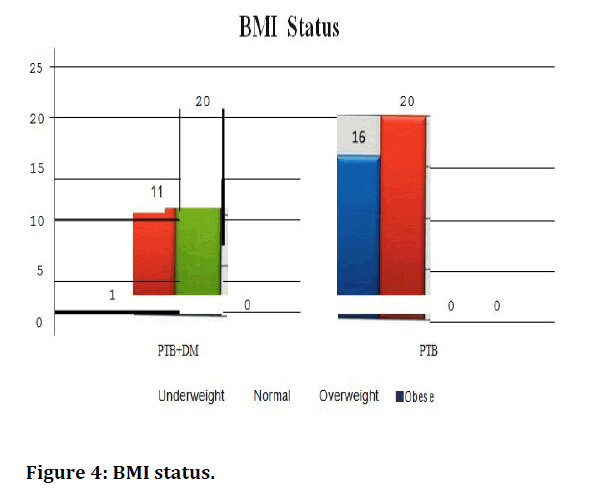
Figure 4. BMI status.
| Case | Smokers | X-Smokers | Non-smokers |
|---|---|---|---|
| PTB-DM | 22 | 1 | 9 |
| PTB | 21 | 0 | 15 |
Table 7: Smoking.
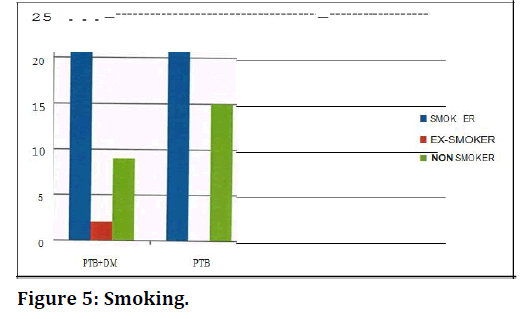
Figure 5. Smoking.
By conventional criteria the association between the study groups and alcohol intake status is not considered statistically significant since p > 0.05. In patients belonging to PTB-DM group, majority were alcoholics (n=20, 62.50%) followed by non-alcoholics (n=l 1, 34.38%). In PTB group, majority were alcoholics (n=27, 75.00%) followed by non-alcoholics (n=9, 25.00%) (Table 8 and Figure 6).
| Alcohol Intake Status | PTB+DM | PTB | PTB+DM (%) | PTB (%) |
|---|---|---|---|---|
| Alcoholic | 20 | 27 | 62.5 | 75 .00 |
| Non Alcoholic | 11 | 9 | 34.38 | 25 |
| Ex-Alcoholic | 1 | 0 | 3.13 | 0 |
| Total | 32 | 36 | 100 | 100 |
| P Value Fishers Exact Test | 0.3515 | |||
Table 8: Alcohol intake status.
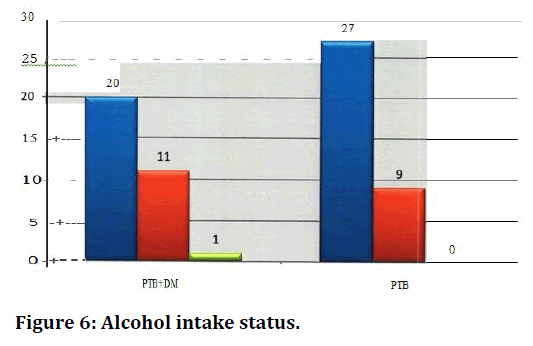
Figure 6. Alcohol intake status.
Discussion
In the present study of age and gender distribution the patients belonging to PTB - DM group, the mean age is 57. 47 years with majority belonging to 41-60 years age group (78.13%) ,followed by 61 -80 years age group (21 . 88%). In PTB group, the mean age is 39. 81 years with majority belonging to 21 -40 years age group (47.22%) foll owed by 41 - 60 years age group (38.89 %). The mean age is more in P TB -DM group compared to the PTB group by 31 % with a mean difference of 1 7.66 years. The number of n" Ie patients are more than the females in both the groups. In P TB-DM males being (71 .88%) followed by females (28.1 3%) and in PTB group also majority belonged to male gender (58.33%) followed by female gender (41.67 %). In a previous study it is shown that the PTB- DM patients were on average older than non- DM TB patients. One study reported that majority of cases of PTB-DM belong to the age group of 45 and above 92. Like our study, studies have also shown that tuberculosis is higher in males. In the study it was reported that 62.9% were males and 37.1 % were females. Others also in their study observed that male population outnumbered the females 93 similar to our study. The high incidence of disease in males is possibly due to the fact that both tuberculosis and diabetes are more common in males. Smoking and alcohol consumption among them. Smoking and alcohol consumption may be a contributing factor in developing tuberculosis in these patients.
Symptoms of present illness
The common respiratory complaints in PTB-DM were fever (96 A) cough (93. 75%), expectoration (90.63), anorexia (90.63),weight IDSS (87.50%), dypnoea (50%). Hemoptysis (43.75%) and others including giddiness, vomiting etc. (3.13%). The PTB patients presented with cough (94.44%), expectoration (83.33%), fever (72.22%), weight loss (58.33%), inorexia (38.89%), hemoptysis (l3.89), dyspnoea (2.78%), chest pain (2.78%). Although findings were based upon fieelf report of symptoms. Some symptoms of DM and TB: weight loss and fatigue is continent to both. A few studies have shown that the clinical characteristics of TB do not differ among diabetic and non-diabetic patients. As with a typica1 radiographic presentation, a typical presenting signs and symptoms amongst this group of co morbid individuals and the conflicting results between various studies may be due to the control status of DM. There seems to be relatively few studies that looked at the symptoms of co- infected DM and TB patients and with sparse data and contradictory findings further research upon whether TB symptoms a signs differ amongst those with and without DM is needed .
By conventional criteria the association between the study groups and sputum smear status is cons ide red to be statistically significant since p<0.05. In patients belonging to PTB-DM group, majority belonged to 2+ sputum smear status (n=l9, 59.38%) followed by 3+ sputum smear status. In PTB group, majority belonged to 1+sputum smear status (n=l 9, 52.78%) followed by scanty sputum smear status (n=l 1,30.56%). The incidence of 3+ sputum smear status is more in PTB-DM group compared to the PTB group by 93% with a percentage difference of 34.72 points which is statistically significant s the p value is <0.0001 as per fishers exact test indicating a true statistical difference between study groups.
By conventional criteria the association between the study groups and location of lesion in chest x-ray status is considered to be statistically significant since p < 0.05. In patients belonging to PTB-DM group, majority have lower lobe lesions in x-ray chest (n=31) followed by middle lobe lesions (n=33). In PTB group, majority have upper lobe lesions in chest x-ray (n=40) followed by middle lobe (n=12). The incidence of lower lobe lesions in x-ray chest is more in PTB-DM group compared to the PTB group by 89% with a percentage difference of 66.67 points group which is statistically significant as the p value is <0.0001 as per fishers exact test indicating a true statistical difference between study groups.
By conventional criteria the association between the study groups and grade of lesion in chest x-ray status 1s considered to be statistically significant since p<0.05. In patients belonging to PTB-DM group, majority had advanced grade lesions in x-ray chest (n=l 8, 56.25) followed by far advanced grade lesions (n=33, 21.88). In PTB group, majority had minimal grade lesions in x-ray chest (n=l3, 36.11) followed by moderate grade lesions (n=l 1, 30.56). The incidence of advanced and far advanced grade lesions in x-ray chest is more in PTB+DM group compared to the PTB group by 57% with a percentage difference of 44. 79 points. The increased incidence of advanced and far advanced grade lesions in x-ray chest in PTB-DM group compared to the PTB group is statistically significant as the p value is 0.0016 as per fisher’s exact test indicating a true statistical difference between study groups [9-30].
Conclusion
The severity of tuberculosis in terms of, grade of radiological lesions, sputum mycobacterial load was compared between TB patients and TB-DM patients. All the patients in the study were given the same treatment consisting of a standard regimen of daily rifampicin, isoniazid, pyrazinamide, and ethambutol for 2 months, the Intensive phase(IP) and rifampicin and isoniazid for another 4 months ,the continuation phase(CP). Patients were then followed biweekly during the intensive phase and monthly thereafter. History, physical examination, FBS and PPBS and microscopic examination of sputum samples will be repeated at the end of 2, 3, 5 and end of treatment. The treatment response in terms of, sputum conversion at the end of 2, 3, 5 months and the end of treatment were compared between patients with patients with TB and TB-DM.
Funding
No funding sources.
Ethical Approval
The study was approved by the Institutional Ethics Committee.Conflict of Interest
The authors declare no conflict of interest.Acknowledgements
The encouragement and support from Bharath Institute of Higher Education and Research, Chennai is gratefully acknowledged. For provided the laboratory facilities to carry out the research work.References
- Hopewell PC. A clinical view of tuberculosis. Radiol Clin North Am 1995; 33:641–53.
- McAdams HP, Erasmus J, Witner JA. Radiologic manifestations of pulmonary tuberculosis. Radiol Clin North Am 1995; 33:655–78.
- Kim WS, Moon WK, Kim IO, et al. Pulmonary tuberculosis in children: evaluation with CT. AJR 1997; 168:1005–9.
- Woodring JH, Vandiviere HM, Fried AM, et al. Uptade: The radiographic features of pulmonary tuberculosis. AJR 1986; 146:497–506.
- Palmer PES. Pulmonary tuberculosis-usual and unusual radiographic presentations. Semin Roentgenol 1979; 14:204–43.
- Havlir DV, Barnes PF. Tuberculosis in patients with human immunodeficiency virus infection. N Engl J Med 1999; 340:367–73.
- Leung AN, Müller NL, Pineda PR, et al. Primary tuberculosis in childhood: Radiographic manifestations. Radiology 1992; 182:87–91
- Miller WT, Miller WT. Tuberculosis in the normal host: radiological findings. Semin Roentgenol 1993; 28:109–18.
- Im JG, Song KS, Kang HS, et al. Mediastinal tuberculous lymphadenitis: CT manifestations. Radiology 1987; 164:115–9.
- Pombo F, Rodriguez E, Mato J, et al. Patterns of contrast enhancement of tuberculosis lymph nodes demonstrated by computed tomography. Clin Radiol 1992; 46:13–7.
- Itoh H, Shim YS, Lee JH, et al. Pulmonary tuberculosis: CT findings—early active disease and sequential changes with antituberculous therapy. Radiology 1993; 186:653–60.
- Poey C, Verhaegen F, Giron J, et al. High resolution chest CT in tuberculosis: Evolutive patterns and signs of activity. J Computed Assit Tomogr 1997; 21:601–7.
- Goo JM, Im JG. CT of tuberculosis and nontuberculous mycobacterial infections. Radiol Clin North Am 2002; 40:73–87.
- Lee SK, Om JG. CT in adults with tuberculosis of the chest: Characteristic findings and role in management. AJR 1995; 164:1361–7.
- Hadlock FP, Park SK, Awe RJ, et al. Unusual radiographic findings in adult pulmonary tuberculosis. AJR 1980; 134:1015–8.
- Maranjuola D. Fluid levels in pulmonary tuberculosis cavities in a rural population of Nigeria. AJR 1983; 141:519–20.
- Hatipoglu ON, Osma E, Manisali M, et al. High resolution computed tomographic findings in pulmonary tuberculosis. Thorax 1996; 51:397–402.
- Andreu J, Mauleon S, Pallisa E, et al. Miliary lung disease revisited. Curr Probl Diagn Radiol 2002; 31:189–97.
- Kwong JS, Carignan S, Kang EY, et al. Miliary tuberculosis. Diagnostic accuracy of chest radiography. Chest 1996; 110:339–42.
- Lee KS, Kim TS, Han J, et al. Diffuse micronodular lung disease: HRCT and pathologic findings. J Comput Assit Tomogr 1999; 23:99–106.
- Voloudaki AE, Tritou IN, Magkanas EG, et al. HRTC in miliary lung disease. Acta Radiologica 1999; 40:451–6.
- Jamieson DH, Cremin BJ. High resolution CT in acute disseminated tuberculosis and a pediatric radiology perspective of the term “miliary”. Pediatr Radiol 1993; 23:380–3.
- Im JG, Webb WR, Han MC, et al. Apical opacity associated with pulmonary tuberculosis: High-resolution CT findings. Radiology 1991; 178:727–31.
- Akhan D, Demirkazik FB, Ozmen MN, et al. Tuberculous pleural effusions: Ultrasonic diagnosis. J Clin Ultrasound 1992; 20:461–5.
- Galdermans D, Verhaert J, Van Meerbeeck J, et al. Broncholithiasis: present clinical spectrum. Respir Med 1990; 84:155–6.
- Boyer L, Perez N, Michel JL, et al. Solitary tuberculous node of fatty density. Rev In Med 1993; 5:53–5.
- Logan PM, Müller NL. CT manifestations of pulmonary aspergillosis. Crit Rev Diagn Imaging 1996; 37:1–37.
- Hong SH, Im JG, Lee JS, et al. High resolution CT findings of miliary tuberculosis. J Comp Assist Tomogr 1998; 22:220– 4.
- Adler O, Peleg H. Computed tomography in diagnosis of broncholithiasis. Eur J Radiol 1987; 7:211–2.
- Oh YW, Kim YH, Lee NJ, et al. High-resolution CT appearance of miliary tuberculosis. J Comput Assit Tomogr 1994; 18:862– 8.
Author Info
Nair Shraddha, V Suryanarayana and Raja Amarnath G*
Department of Pulmonary Medicine, Sree Balaji Medical College & Hospital Affiliated to Bharath Institute of Higher Education and Research, Chennai, Tamil Nadu, IndiaCitation: Nair Shraddha, V Suryanarayana , Raja Amarnath G,Study of Pulmonary Tuberculosis in Diabetes Patients, J Res Med Dent Sci, 2021, 9(6): 384-391
Received: 08-May-2021 Accepted: 23-Jun-2021
