Research - (2021) Volume 9, Issue 6
Evaluating Six Minute Walk Test as a Tool to Assess the Severity of COPD
*Correspondence: Raja Amarnath G, Department of Respiratory Medicine, Sree Balaji Medical College & Hospital Affiliated to Bharath Institute of Higher Education and Research, India, Email:
Abstract
This study focuses on 6MWT sensitive tool to assess the severity of COPD and it correlates well with the currently used severity index of FEV1%. Similarly, the CAT test also correlates well with FEV1% indicating that it is a better measure of the impact of COPD on the functional status of the individual. Moreover, both these test values correlate well with each other authenticating their use in clinical practice to assess the severity and determine the impact of disease among the COPD patients. The present study includes correlation between the distance covered in the 6- minute walk test (6MWT) and COPD Assessment Test (CAT) scores among the study sample and also study was done to evaluate the 6 minute walk test (6MWT) as tool to assess severity of COPD based on spirometry and to study the correlation between the distance covered in the 6 minute walk test (6MWT) and COPD Assessment Test (CAT) score among 60 patients diagnosed with COPD.
Keywords
6 MWT, COPD, Spirometry, Dyspnea, Nebulizer, Hypertrophy, ANOVA, Hypertension.
Introduction
Chronic Obstructive Pulmonary Disease (COPD) includes chronic bronchitis and emphysema. It is a very common, preventable and treatable disease characterized by persistent respiratory symptoms and limitation of airflow because of airway and alveolar abnormalities caused by exposure to noxious particles and gases. It is one of the leading causes of mortality and morbidity worldwide [1]. The prevalence of COPD varies widely across countries. The global prevalence of COPD is approximately 9 to 10% [2]. In India, the prevalence of COPD ranges from 3.49% to 10% across the country [3]. A recently conducted study reported the prevalence to be on the rise and it reported from 6.25% in Pune to 16.05% in Srinagar [4]. In India, the DALYs per person due to COPD is 107 times higher than the global average indicating the need for early and prompt detection of the disease followed by appropriate management. Moreover, it was reported recently that air pollution is the leading risk factor for COPD in India being accounting for a higher COPD burden than smoking [5].
One of the most prominent symptoms and features of COPD is the restriction of physical activity in daily life [6]. This restriction of daily physical activity leads to increased social isolation and depression [7]. According to the Global Initiative for Chronic Obstructive Lung Disease (GOLD) guidelines, the major focus of treatment of COPD should be placed on the improvement in the functional status of the patient [8]. Furthermore, studies have shown that exercise capacity is consistently correlated with mortality more than the lung function or occurrence and severity of dyspnea [9].
Management of COPD includes patient education, preventive care, cessation of smoking, pharmacological therapy and pulmonary rehabilitation [10]. Conventionally, COPD severity is graded according to the degree of airflow limitation evident in spirometry and expressed in the form of forced expiratory volume in one second (FEV1) of the forced vital capacity (FVC) maneuver. Even though FEV1 is considered a good predictor of morbidity and mortality, it is not a reliable predictor of dyspnea which is the most frequent manifestation in COPD and also is a poor predictor of functional capacity of the patient survival, and frequency of hospitalization in patients with severe obstruction [11,12]. Spirometry is considered as the gold standard for diagnosis, grading of severity and to assess the response to treatment in COPD [8]. However, the facility of spirometry is not always available, especially in rural areas. Therefore, to assess the severity and progression of the disease along with the functional status of the patient, various exercise tests were tested and validated. Among the tests to assess the functional status of the COPD patients, the 6-minute walk test (6MWT) has gained importance and is commonly used, since it is safe, easy to use and inexpensive besides being reliable. It is more reflective of the daily life physical activity and functional status than the cardio-pulmonary exercises. It is also used as an outcome measure for assessment and management of COPD and similarly it correlates well with the survival chances [13-16]. Though there are studies that have validated the use of 6-minute walk test as a determinant of disease severity and progression of the disease, there is a paucity of data in the Indian population with regards to the use of 6-minute walk test for assessment of severity in COPD.
A simple patient completed questionnaire called ‘The COPD Assessment Test (CAT)’ was approved to evaluate the impact of COPD on the health status of the patient and it is a scoring system containing eight items being validated on the lines of St.George’s Respiratory Questionnaire (SGRQ) [17,18]. With this background, this study was planned to evaluate the 6- minute walk test for assessment of severity of COPD and to study its correlation with ‘The COPD Assessment Test’ in predicting the impact of COPD on the health status of the COPD patients attending the Department of Respiratory Medicine, Sree Balaji Medical College, Chromepet, Chennai.
Materials and Methods
Study area
The study was conducted in the Department of Pulmonary Medicine, Sree Balaji Medical College, Chromepet, Chennai.
Study period
The timeline of this study is depicted below in the Henry Gantt chart.
Study population
The study population included 60 patients diagnosed with Chronic Obstructive Pulmonary Disease (COPD) according to the Global Strategy for the Diagnosis, Management and prevention of COPD (GOLD) criteria attending the Department of Pulmonary Medicine, Sree Balaji Medical College, Chromepet, Chennai during the study period.
Inclusion criteria
All stable patients above 40 years of age.
All patients irrespective of Gender.
All patients who gave consent to participate were included in the study
Exclusion criteria
- Patients with Obstructive lung disease other than COPD.
- Patients with associated lung infections/diseases. E.g. Tuberculosis, pleural effusion, pulmonary hypertension, etc.
- Corpulmonale/ Congestive cardiac failure.
- Orthopaedic diseases associated with walking difficulty.
- Neurological diseases limiting the patient from walking.
- Patients with recent myocardial infarction or unstable angina.
- All patients who enrolled for the study were interviewed and relevant data was collected as mentioned below:
- Demographic data: Age, Gender, Patient Identification number.
- Clinical history: Symptomatology, Smoking history, past history of any associated lung conditions, History for comorbidities.
- Clinical Examination was done in all patients before they were subjected to Pulmonary Function tests and 6-minute walk test.
- Chest X-ray, Electrocardiograph and Echocardiogram were taken in all patients.
Pulmonary function tests
Spirometry test was performed in all patients according to the criteria set by the American Thoracic Society (ATS)/ERS Guidelines for standardization of Lung function testing [19] and the test procedure was clearly explained to all patients before initiation of the test.
All patients were advised to wear loose-fitting clothes to avoid any restriction of chest movement by clothing and were examined for any ill- fitting dentures in the oral cavity.
The test was done in the sitting posture in all patients. The test was done in patients who had a large meal within 2 hours and in patients who smoked within 1 hour of reporting to the test.
Patients who have consumed alcohol were not included in the test.
All patients were given proper instruction to hold the head in a slightly elevated manner and to position the mouthpiece with closed lips.
They were instructed to inhale completely and rapidly exhale maximally until no more air can be expelled. These instructions were repeated if needed. The test was stopped when the patients complained of distress or dizziness.
The test was repeated until two acceptable and reproducible tests for both FEV1 and FVC were obtained. All the measurements were taken before and after 15 minutes of administration of two puffs of (200 ug) salbutamol given through metered-dose inhaler with a volumetric spacer (Figure 1).
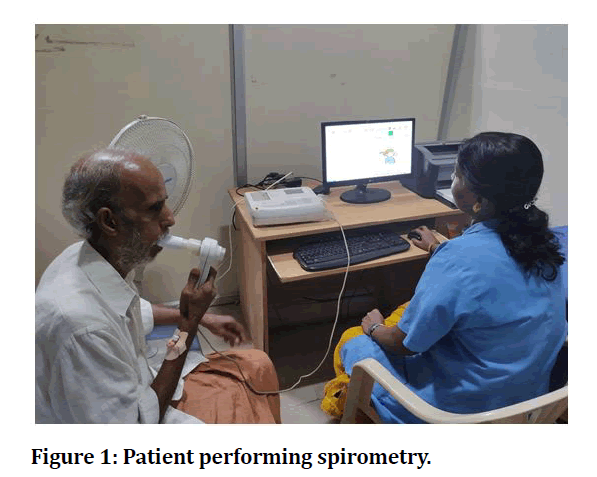
Figure 1: Patient performing spirometry.
The severity of COPD was assessed according to postbronchodilator FEV1 using the GOLD guidelines as follows:
- GOLD Stage I: Mild grade COPD with FEV1 ≥80% of the predicted value.
- GOLD Stage II: Moderate grade COPD with FEV1 ≥50% but less than 80% of the predicted value.
- GOLD Stage III: Severe grade COPD with FEV1 ≥30% but less than 50% of the predicted value.
- GOLD Stage IV: Very Severe grade COPD with FEV1 <30%.
Six minute walk test
The test was done according to the American Thoracic Society (ATS) Guidelines [16]. All patients were asked to wear loose and comfortable clothing and fitting footwear. The test was conducted in the hospital premises in a 35- meter corridor and every meter was marked.
Baseline heart rate and oxygen saturation by using pulse oximetry was done for all patients before the initiation of the test. The emergency crash cart which included oxygen, salbutamol MDI and nebulizer, aspirin, sublingual nitrates were kept ready in the study area.
All patients were given proper instructions to walk back and forth but not to run or jog and they were instructed to quit whenever they feel uncomfortable because of increasing dyspnea or chest pain, leg cramps.
They were instructed to follow their own pace maximally and if needed they can rest by leaning on the wall in between the test and resume when they feel comfortable again. Patients were encouraged during the test to motivate them to walk as far as possible and they were congratulated at the end of the test and posttest heart rate and oxygen saturation by using pulse oximetry was measured in all patients (Figure 2).
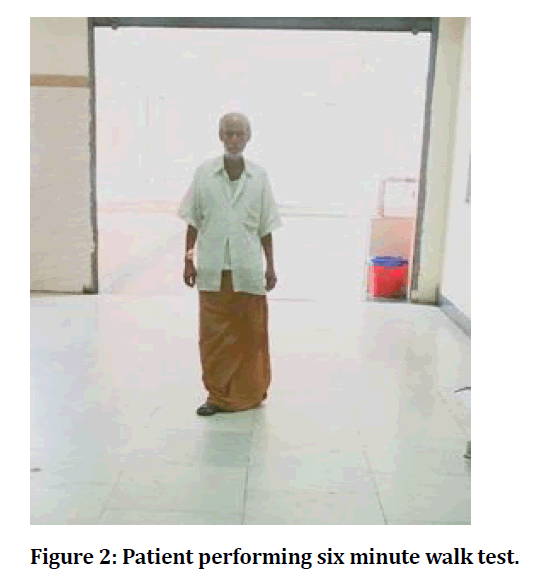
Figure 2: Patient performing six minute walk test.
Study overview
The following flow chart shows an overview of this study (Figure 3).
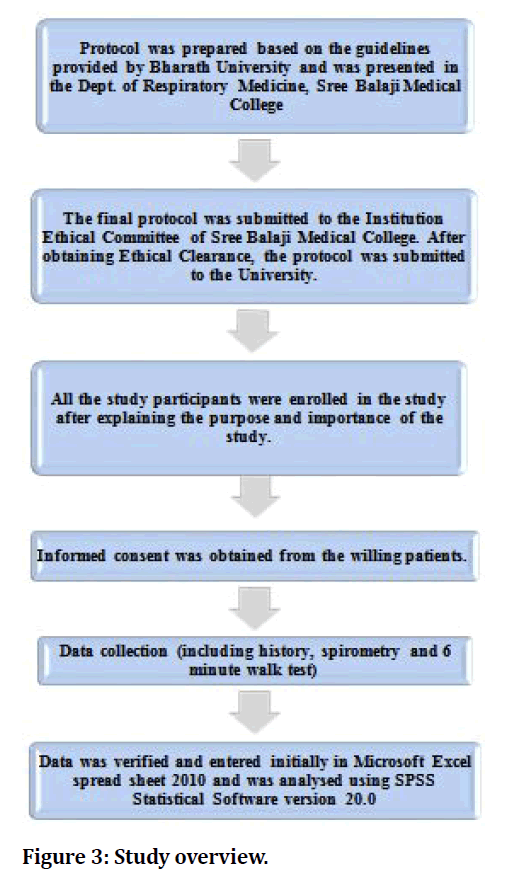
Figure 3: Study overview.
Statistical analysis
All the data was entered initially into Microsoft Excel 2010 and then these spread sheets were used for analysis and statistical analysis was done using SPSS version 20.0. Descriptive statistics were calculated as frequency, percentage, mean and standard deviation, median and inter-quartile range and depicted using various tables, graphs, diagrams, etc. Various tests of significance were used according to the type of variable for inferential statistics. Parametric tests like student‘t’ test was used to compare the means of continuous variables after ensuring that the variable followed normal distribution. Tests for normality such as Kolmogorov Smirnov Test were used to test whether the data followed normal distributions or not. Since the test was statistically not significant (p=0.584), the data was assumed to follow a normal distribution. ‘Z’ test was used for comparison of column proportions. A chi-square test was used to compare the various categorical variables. One way ANOVA was employed to test for difference in FEV1%, CAT score and distance covered in 6-minute walk test (Within subjects factor) between severity groups of COPD based on GOLD criteria (Between subjects factor) Pearson’s correlation was used to study the linear relationship between continuous variables such as FEV1%, CAT score and distance covered in 6-minute walk test. The p-value of <0.05 was used to reject the null hypothesis in all the statistical tests of significance.
Results
Results are detailed in the form of tables (Table 1 to Table 7) and figures (Figure 4 to Figure 9).
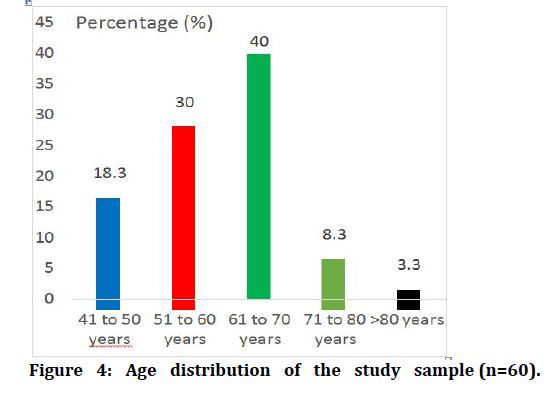
Figure 4: Age distribution of the study sample (n=60).
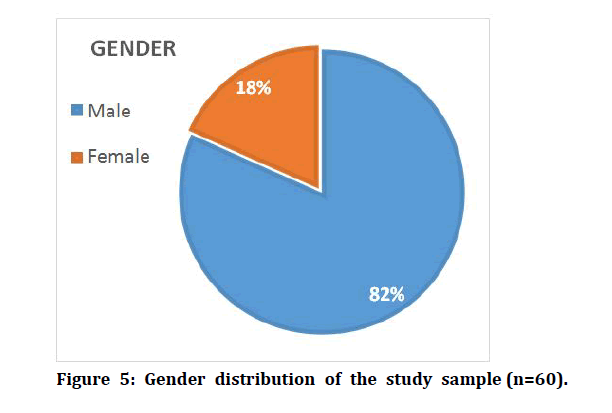
Figure 5: Gender distribution of the study sample (n=60).
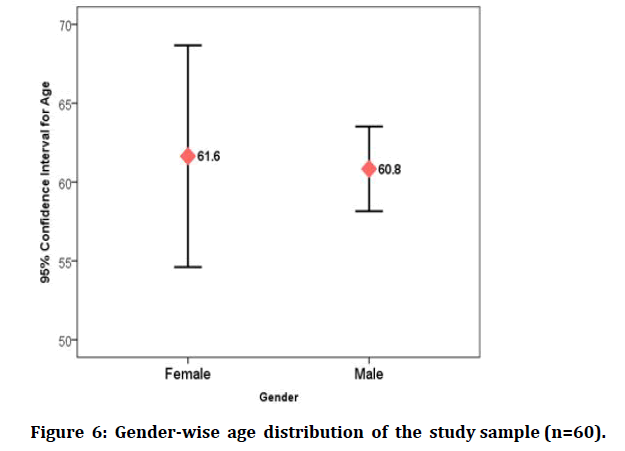
Figure 6: Gender-wise age distribution of the study sample (n=60).
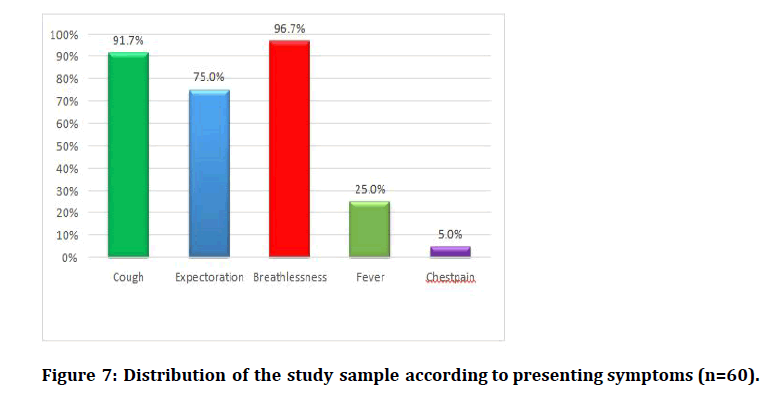
Figure 7: Distribution of the study sample according to presenting symptoms (n=60).
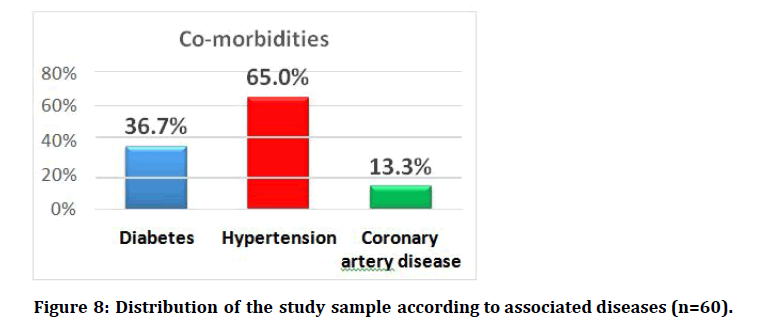
Figure 8: Distribution of the study sample according to associated diseases (n=60).
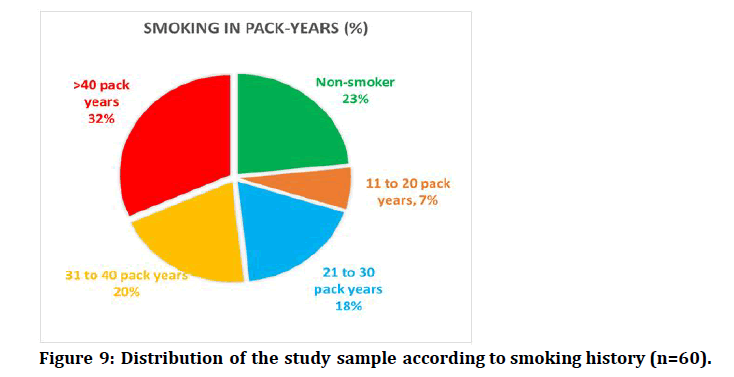
Figure 9: Distribution of the study sample according to smoking history (n=60).
Table 1: Age distribution of the study sample (n=60).
| Age group | Frequency (n) | Percentage (%) |
|---|---|---|
| 41 to 50 years | 11 | 18.3 |
| 51 to 60 years | 18 | 30 |
| 61 to 70 years | 24 | 40 |
| 71 to 80 years | 5 | 8.3 |
| >80 years | 2 | 3.3 |
| Total | 60 | 100 |
Mean Age: 60.98 years
Standard deviation: 9.472 years Maximum age: 82 Years
Minimum Age: 43 years
Table 2: Gender distribution of the study sample (n=60).
| Gender | Frequency (n) | Percentage (%) |
|---|---|---|
| Male | 49 | 81.7 |
| Female | 11 | 18.3 |
| Total | 60 | 100 |
Comments: The majority of the COPD subjects were males (roughly 82%).
Table 3: Gender-wise age distribution of the study sample (n=60).
| Gender | N | Mean age (years) | Std. Deviation | Mean Difference | Student ‘t’ test p-value |
|---|---|---|---|---|---|
| Male | 49 | 60.84 | 9.346 | 0.8 | 0.803 |
| Female | 11 | 61.64 | 10.462 |
The difference in mean age between the two genders was not statistically significant (p>0.05).
Table 4: Distribution of the study sample according to presenting symptoms (n=60).
| Symptoms | Frequency (n) | Percentage (%) |
|---|---|---|
| Cough | 55 | 91.7 |
| Expectoration | 45 | 75 |
| Breathlessness | 58 | 96.7 |
| Fever | 15 | 25 |
| Chest pain | 3 | 5 |
The commonest presenting symptom was breathlessness which was present in almost all the subjects followed by cough.
Table 5: Distribution of the study sample according to associated diseases (n=60).
| Disease* | Frequency (n) | Percentage (%) |
|---|---|---|
| Diabetes | 22 | 36.7 |
| Hypertension | 39 | 65 |
| Coronary artery disease | 8 | 13.3 |
* Not mutually exclusive
The commonest associated disease was hypertension followed by diabetes.
Table 6: Distribution of the study sample according to smoking history (n=60).
| Smoking in pack-years | Frequency (n) | Percentage (%) |
|---|---|---|
| Non-smoker | 14 | 23.3 |
| 11 to 20 pack years | 4 | 6.7 |
| 21 to 30 pack years | 11 | 18.3 |
| 31 to 40 pack years | 12 | 20 |
| >40 pack years | 19 | 31.7 |
| Total | 60 | 100 |
About one-third of the study subjects were heavy smokers with more than 40 pack years.
Table 7: Distribution of the study sample according to X-ray findings (n=60).
| X-ray finding* | Frequency (n) | Percentage (%) |
|---|---|---|
| Normal | 3 | 5 |
| Emphysema | 37 | 61.7 |
| Increased Broncho-vascular markings | 25 | 41.7 |
| Cardiomegaly | 20 | 33.3 |
| Right descending pulmonary artery diameter >16mm | 21 | 35 |
*not mutually exclusive
The commonest X-ray finding was emphysematous changes.
Discussion
This institution-based observational study was conducted to evaluate the 6 minute walk test (6MWT) as tool to assess severity of COPD based on spirometry and to study the correlation between the distance covered in the 6 minute walk test (6MWT) and COPD Assessment Test (CAT) score reflecting the impact of COPD on health status of patients attending the Department of Pulmonary Medicine, Sree Balaji Medical College, Chromepet, Chennai. The study included 60 patients diagnosed with COPD according to the GOLD criteria based on FEV1% [20,21].
Demographic factors: The mean age (± S.D) of the study sample was roughly 61 years and a majority of the sample were in 51 to 60 years (30%) and 61 to 70 years (40%) age group. According to previous study, the mean age was 59.6 years while Jones et al. [17] reported a mean age of 65.3 years which is a little higher than age observed in the current study. MacNee et al. [22] also reported that 86.7% of COPD patients as males.
Fabbri et al. [23] observed that 55% of subjects were above 60 years of age which is higher than the finding observed in the current study. There was a male predilection in the study sample as roughly 82% of the subjects were males and this finding can be associated with the gender differences in the risk factors especially smoking. Similar findings were observed by Fairclough et al. [24] in which 83% and 90% of the subjects were males, respectively. In the same way,
Symptoms: The commonest presenting symptom was breathlessness which was present in 96.7% of the subjects followed by cough in 92%. Expectoration of sputum was present in 75% while fever and chest pain was present in 25% and 5%, respectively.
Co-morbidities: The commonest associated disease was hypertension (65%) followed by diabetes (36.7%). Coronary artery disease was present in 13.3% of subjects.
Smoking: A positive smoking history was present in 76.7% of subjects and roughly one-third (31.7%) of the study subjects were heavy smokers with more than 40 pack years.
X-ray findings: The commonest X-ray finding was emphysematous changes seen in 61.7% while increased Broncho-vascular markings and right descending pulmonary artery diameter >16mm were seen in 41.7% and 35%, respectively. Cardiomegaly seen in 33.3%.
ECG findings: The commonest ECG finding was ‘p’ pulmonale present in 55% while right ventricular hypertrophy (RVH) was seen in 36.7% and low-voltage complexes seen in 28.3%. Incomplete Right Bundle Branch Block (RBBB) was noted in 11.7%.
ECHO findings: The commonest ECHO finding was RA/RV dilatation (43.3%) followed by Right ventricular hypertrophy (41.7%). Left ventricular diastolic dysfunction was seen in 33.3% while RV systolic dysfunction and inter-ventricular septum motion abnormality were present in 21.7%. Roughly half of the subjects (46.7%) had pulmonary hypertension as a sequelae of COPD.
Distance covered in 6-minute walk test (6MWT): Mean distance covered was 279.8 meters with an S.D of 96.4 meters. Roughly two-thirds of the subjects (66.7%) were able to walk only for a distance of less than 300 meters in a 6-minute walk test. About 25% were able to walk for a distance between 101 to 200 meters while 20% were able to cover 301 to 400 meters.
CAT score: The mean score was 20.48 with an S.D of 4.04. The median CAT score was 20 with an IQR of 17 to 23. About 57% had medium impact (10-20) of COPD while 41.7% had high impact (21-30) according to CAT scoring. According to Mahler et al [12], the mean CAT score was 19.6 which is very similar to the current study finding. Alwan et al. [19] reported a mean CAT score of 20.49.
Spirometry indices: The Forced Expiratory Volume in 1 second (FEV1) was 1.08 ± 0.40 similar to that of Enright et al [15] as they reported an FEV1 of 1.04 ± 0.39 and Naghshin MD et al [13] reported 1.16 ± 0.42. The FEV1% was 47.02 ± 16.68 which is comparable to that of Sciurba et al. [13] with 42.5% and 46% as observed by Jones et al [17].
GOLD criteria for severity of COPD: About 45% and 26.7% had severe (FEV1: 30-49%) and very severe COPD (FEV1<30%), respectively. Moderate COPD (FEV1: 50-79%) was present in 21.7% while mild COPD was present in 6.7%. According to Alwan et al [19], mild and moderate COPD was present in 5.3% and 24% while severe and very severe COPD was seen in 56% and 14.7%. Similarly, mild and moderate COPD was present in 0% and 51.2% while severe and very severe COPD was seen in 43.8% and 5%. These findings are comparable to that of the present study.
Correlation of CAT score with COPD severity (FEV1%): As severity of COPD increased (fall in FEV1%), the CAT score also increased and there was a statistically significant difference of mean CAT score between- subjects groups classified according to COPD severity with difference in CAT score between Moderate Vs. Severe and Moderate Vs. Very Severe group being statistically significant.
Difference in distance covered in 6MWT with COPD severity (FEV1%): As severity of COPD increased (fall in FEV1%), the distance covered in 6MWT decreased and there was a statistically significant difference of mean distance covered in 6MWT between-subjects groups classified according to COPD severity with difference in distance walked between Moderate Vs. Very Severe and Severe Vs. Very Severe group being statistically significant. Similar to the current study findings, Sciurba et al [13] also observed a statistically significant difference in mean distance covered in 6MWT between groups based on COPD severity. Association of X-ray finding with COPD severity (FEV1%): The only X- ray finding, presence of which was associated with a statistically significant reduction in FEV1% and severity of COPD was increased diameter of RDPA (>16mm).
Association of ECG finding with COPD severity (FEV1%): The presence of any of the ECG findings related to COPD was associated with a statistically significant reduction in FEV1% and the ECG findings are much more common in severe and very severe COPD. Association of ECHO finding with COPD severity (FEV1%): Presence of left ventricular diastolic dysfunction and inter-ventricular septum motion abnormality was associated with a statistically significant reduction in FEV1% and both these findings.
Conclusion
Based on the findings observed in the study it can be concluded that there was a statistically significant difference in mean distance covered in 6MWT and mean CAT score between subjects classified according to the severity of COPD. Both 6-minute walk test and COPD assessment test showed a significant correlation with FEV1 and hence 6-minute walk test can be employed to assess the severity of COPD while COPD assessment test can be used to determine the impact of COPD, especially in the absence of spirometry or for follow-up of the patient. Both 6-minute walk test and COPD assessment test correlate with age and hence age should also be considered as a factor while interpreting the test results and also these tests correlate well with each other authenticating their use in clinical practice.
Funding
No funding sources.
Ethical Approval
The study was approved by the Institutional Ethics Committee.
Conflicts of Interest
The authors declare no conflict of interest.
Acknowledegements
The encouragement and support from Bharath University, Chennai is gratefully acknowledged. For provided the laboratory facilities to carry out the research work.
References
- Wolf PA, Abbott RD, Kannel WB. Atrial fibrillation, a major contributor to stroke to stroke in the elderly: The framingham study. Arch Intern Med 1987; 147:1561-1564.
- Kannel WB, Wolf PA, Verter J. Manifestations of coronary disease prodisposing to stroke : The framingham study. JAMA 1983; 250: 2942-2946.
- Schocken DD, ARrieta MI, Leaverton PE, et al. Prevalence and mortality rate of congestive heart failure in the United States. J Am Coll Cardiol 1992; 20:301-306.
- https://accessmedicine.mhmedical.com/book.aspx?bookID=1477
- McDonagh TA, Morrison CE, Lawrence A, et al. Symptomatic and asymptomatic left ventricular systolic dysfunction in an urban population. Lancet 1997; 350:829-32.
- Brockell. Prevalence of left ventricular dysfunction in the general population. J Am CollCardiol 1996; 27:25.
- Ward R, Jones D, Haponik EF. Paradoxical embolism, an under diagnosed problem. Chest 1995; 108:549-558.
- Wilson PW. An epidemiologic perspective of systemic hypertension, ischaemic heart disease and heart failure. Am J Cardiol 1997; 80: 3J-8J.
- Solvd investigators. Effect of enalapril on mortality and development of heart failure in asympotmatic patients with reduced left ventricular ejection fractions. N Engl J Med 1992; 327:685-91.
- Pfeffer MA, Braunwald E, Moye La, et al. Effect of captopril on mortality in patients with left ventricular dysfunction after myocardial infarction: Results of the survival and Ventricular Enlargement study. N Engl J Med 1992; 327:669-77.
- Gorelick RB. Stroke prevention. Arch Neurol 1995; 52:347-355.
- Rosamond WD, Folsom AR, Chambless L, et al. Stroke incidence and survival among middle aged adults. Stroke 1990; 30:736-743.
- Fabris F, Zanocchi M, Bo M, et al. Prevalence and determinants of carotid atherosclerosis in a general population . Stroke 1994; 25: 1133 -1140 .
- Wilson PW, HoegJm, D’ Agostino RB, et al. Cumulative effects of high cholesterol levels, high blood pressure, and cigarette smoking on carotid stenosis. N Engl J Med 1997; 337:516-522.
- Vaitkus PT, Berlin JA, Schwartz JS, et al. Stroke complicating acute myocardial infarction. A meta-analysis of risk modification by anticoagulation and thrombolytic therapy. Arch Intern Med 1992; 152:352-357.
- Serena J, Segura T, Perez- Ayuso MJ, et al. The need to quantify right - to-left shunt in acute ischemic stroke: A case- control study. Stroke 1998; 29:1322-1328 .
- Jones EF, Calafiore P, Donnan GA, et al. Evidence that patent foramen ovale is not a risk factor for cerebral ischemia in the elderly. Am J Cardiol 1994; 74:596-599.
- Hanna JP, Sun JP, Furlan AJ, et al. Patent foramen ovale and brain infarct. Echocardiographic predictors, recurrence and prevention. Stroke 1994; 25:782-786.
- Nishimura RA, McGoon MD, Shub C, et al. Echocardiographically documented mitral valve prolapse. Long- term follow- up of 237 patients. N England J Med 1985; 313:1305-1309.
- Longstreth WT, Litwin PE, Weaver WD. Myocardial intarction, thrombolytic therapy and stroke. A community- based study. The MITI Project Group. Stroke 1993; 24:587-590.
- Bautista RE. Embolic stroke following thrombolytic therapy for myocardial infarction in a patient with preexisting ventricular thrombi. Stroke 1995; 26:324-325.
- De Simone G, Devereux RB, Daniels SR, et al. Effect of growth on variability of left ventricular mass: Assessment of allometric signals in adults and children and their capacity to predict cardiovascular risk. J Am CollCardiol 1995; 25:1056-1062.
- Goldstein S. The electrocardiogram in stroke: Relationship to pathophysiological type and comparison with prior tracings. Stroke 1979; 10:253-259.
Author Info
Department of Respiratory Medicine, Sree Balaji Medical College & Hospital Affiliated to Bharath Institute of Higher Education and Research, Chennai, Tamil Nadu, IndiaCitation: Anand KR, Raja Amarnath G, Evaluating Six Minute Walk Test as a Tool to Assess the Severity of COPD, J Res Med Dent Sci, 2021, 9(6): 269-277
Received: 27-Mar-2021 Accepted: 21-Jun-2021
