Research Article - (2023) Volume 11, Issue 1
Detection and Isolation of P-Coumaric Acid from Chloroform Extract of Iraqi, Cicer arietinum as well as Characterization Using Various Techniques (HPTLC, TLC, Preparative TLC, UV, IR)
Rawnaq Jamal Madhloom1* and Mohammed Kamil Hadi2
*Correspondence: Rawnaq Jamal Madhloom, Department of Pharmacognosy and Medicinal Plants, College of Pharmacy, University of Baghdad, Baghdad, Iraq, Email:
Abstract
In all stages of the drug discovery and development process, analysis of pharmaceutical and natural chemicals, as well as newer pharmaceuticals, is routinely used. The entire potential of thin layer chromatography is exploited by high performance thin layer chromatography, a complex instrumental technique. It is a powerful analytical tool for chromatographic information of complex mixtures of pharmaceuticals, natural products, clinical samples and food items. These features include automation, scanning, full optimization, selective detection principle, minimal sample preparation, hyphenation and other substances.
Keywords
Thin layer chromatography, Instrumental technique, Pharmaceuticals, Hyphenation, Scanning
Introduction
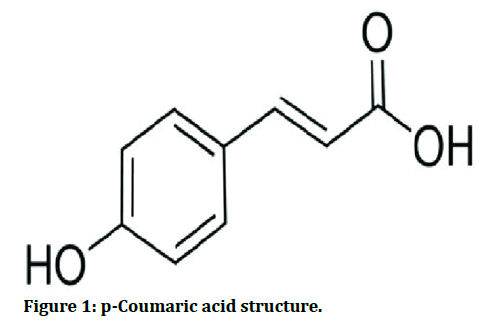
Chickpea (Cicer arietinum) is the world's fifth most important legume in terms of total grain production and Spain’s first common food legume (Figure 1).
Figure 1: p-Coumaric acid structure.
Among legumes, chickpea is generally recognized as a valuable source of dietary proteins and an important part of a daily diet in many countries.
There are several naturally occurring bioactive molecules termed phytochemicals that can provide considerable long term health advantages, according to epidemiologic and nutritional studies. Polyphenols have been identified as the most abundant source of antioxidants in our diet among these substances [1,2].
A phenolic acid, p-coumaric acid (4-hydroxycinnamic acid) is a hydroxyl derivative of cinnamic acid. It suppresses cellular melanogenesis, reduces LDL peroxidation, has anti-mutagenesis, anti-genotoxicity and anti-microbial properties and plays a function in immunological regulation in humans [3].
The shikimate process, which uses phenylalanine and tyrosine as precursors, produces P-Coumaric Acid (p-CA), a phenolic acid belonging to the hydroxycinnamic acid family. Tyrosine ammonia lyase transforms tyrosine to p- CA in plants and mushrooms. Because it can regulate secondary metabolism, p-CA plays a crucial role. Caffeic acid, for example, can be converted to phenolic acids, flavonoids, lignin, ferulic acid, chlorogenic acid and sinapic acid secondary metabolites and precursors [4,5]. According to the benefit of p-comuaric acid in plants for humans, we focused on it and used different methods to detect it in (Cicer arietinum) extract, isolated it and approved it by different technique [6].
Materials and Methods
Experimental
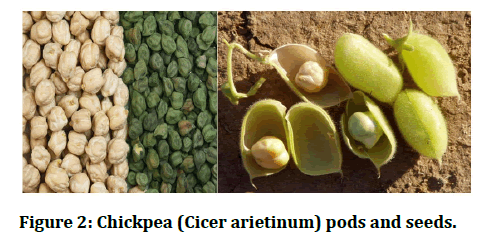
The collection of the plant, preparation of the crude extract, determination of the extractive value and determination of various phytochemicals [7]. The plants have been collected from Kirkuk city, located in the north of Iraq (Figure 2).
Figure 2: Chickpea (Cicer arietinum) pods and seeds.
General procedure
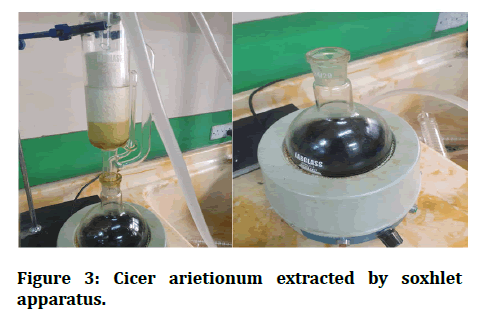
All parts of the plant (seeds, leaves, root) have been chopped and ground to produce powder, then defatting in hexane overnight, later the extract filtered and kept for evaporation under reduced pressure on vacuum rotary evaporated the extract, then after dried put the plant in soxhlet apparatus with methanol for 16 hours then evaporation on vacuum rotary evaporated under reduced pressure, then dissolved with 150 ml water then fractionation with various solvents (chloroform, ethylacetate, n-butanol), phytochemical analysis using thin layer chromatography and HPTLC and preparative TLC, UV, IR (Figure 3) [8-10].
Figure 3: Cicer arietionum extracted by soxhlet apparatus.
Detection by thin layer chromatography
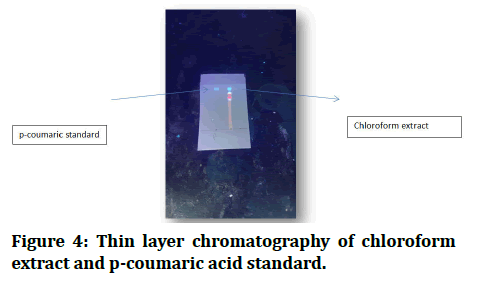
First of all, I activated the thin layer chromatography, which is pre coated silica gel 20 cm × 20 cm (0.25 mm thick) TLC plates from Whatman, in an oven at 60°C for 10 min [11]. Then I used three different mobile phases of toluene: Ethyle acetate: Formic acid (36:12:6), which is ideal, toluene: Acetone: Formic acid, 38:10:5, petroleum ether: Ethyl acetate: Formic acid, 30:15:5 and leave ajar for 20 minutes to saturated [12]. This time, I applied my sample (chloroform extract of Cicer aretienum) and p-coumaric standard as spot by capillary on a TLC plate, then put it in a jar and waited for it to develop. After I took it from the jar and waited for it to dry, after drying, visualization was performed in short UV light (254 nm) [12]. We can notice that the spot of extract and spot of p-coumaric standard are matched (Figure 4).
Figure 4: Thin layer chromatography of chloroform extract and p-coumaric acid standard.
Results and Discussion
Detection by High Performance Thin Layer Chromato graphy (HPTLC)
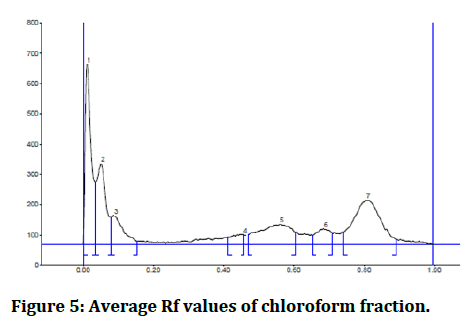
HPTLC was used to determine the phenolic profile for the specified fractions utilizing Eike Reich/CAMAG–laborator (Figure 5).
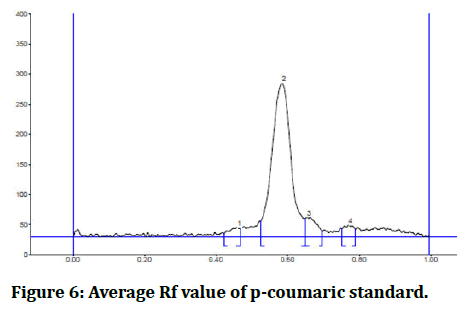
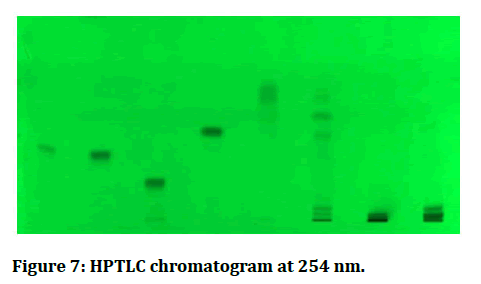
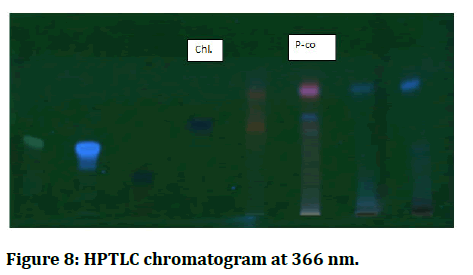
Using a Hamilton syringe and camag linomat 5 instruments, 10 cm x 20 cm silica gel TLC plates were loaded with standards and samples (2 μl of each) [13]. The TLC plate was developed in an automatic developing chamber (ADC, CAMAG), then pre conditioned with 10 ml of a mobile phase containing toluene, ethyl acetate and formic acid (36:12:6) [14]. The plate was developed in the mobile phase up to 75 mm and the solvent was evaporated off the formed plate using hot air [15]. The plate was stored in a photo documentation chamber and photos were taken under white light and UV light (254 nm and 366 nm) (Tables 1 and 2, Figures 6-8) [16].
Figure 5: Average Rf values of chloroform fraction.
| Peak | Start Rf | Start height | Max Rf | Max height | Max% | End Rf | End height | Area | Area% |
|---|---|---|---|---|---|---|---|---|---|
| 1 | 0.00 | 29.9 | 0.01 | 535.9 | 30.29 | 0.04 | 183.9 | 8157.1 | 15.64 |
| 2 | 0.04 | 184.8 | 0.05 | 263.3 | 14.88 | 0.07 | 158.7 | 4507.6 | 8.64 |
| 3 | 0.07 | 161.6 | 0.09 | 259.1 | 14.64 | 0.13 | 40.0 | 6071.4 | 11.64 |
| 4 | 0.13 | 40.7 | 0.14 | 52.0 | 2.94 | 0.19 | 22.5 | 1745.3 | 3.35 |
| 5 | 0.23 | 11.0 | 0.27 | 34.8 | 1.97 | 0.29 | 24.0 | 1080.0 | 2.07 |
| 6 | 0.39 | 27.1 | 0.42 | 51.0 | 2.88 | 0.43 | 47.3 | 1455.0 | 2.79 |
| 7 | 0.49 | 41.5 | 0.56 | 181.8 | 10.28 | 0.61 | 60.3 | 8769.2 | 16.81 |
| 8 | 0.64 | 71.4 | 0.68 | 281.8 | 15.92 | 0.74 | 64.8 | 11569.4 | 22.18 |
| 9 | 0.76 | 63.9 | 0.82 | 109.9 | 6.21 | 0.94 | 20.7 | 8808.8 | 16.89 |
Table 1: Average Rf values of chloroform fraction.
Figure 6: Average Rf value of p-coumaric standard.
| Peak | Start Rf | Start height | Max Rf | Max height | Max% | End Rf | End height | Area | Area% |
|---|---|---|---|---|---|---|---|---|---|
| 1 | 0.41 | 15.0 | 0.43 | 27.6 | 3.60 | 0.44 | 23.4 | 396.9 | 1.22 |
| 2 | 0.44 | 23.4 | 0.47 | 46.4 | 6.05 | 0.48 | 42.6 | 1148.3 | 3.53 |
| 3 | 0.52 | 50.8 | 0.58 | 590.7 | 77.02 | 0,64 | 52.7 | 27805.8 | 85.41 |
| 4 | 0.65 | 53.3 | 0.67 | 69.7 | 9.09 | 0.72 | 25.4 | 2640.5 | 8.11 |
| 5 | 0.72 | 26.4 | 0.72 | 32.5 | 4.24 | 0.75 | 23.4 | 563.4 | 1.73 |
Table 2: Average Rf value of p-coumaric standard.
Figure 7: HPTLC chromatogram at 254 nm.
Figure 8: HPTLC chromatogram at 366 nm.
Based on the similarity of the max Rf and the hue of the bands, the following phenolic compounds were identified: We determined that Cicer aritenum in chloroform fraction has p-coumaric acid by HPTLC because the maximum Rf value of the chloroform fraction is 0.56 and the maximum Rf value of the p-coumaric acid standard is 0.58 and the band color is navy blue.
Isolation by preparative thin layer chromatography
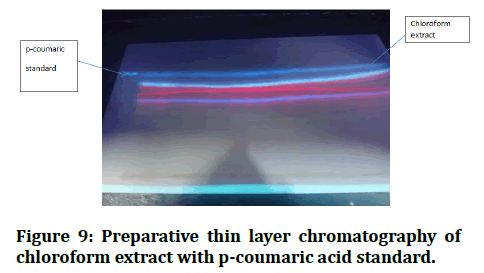
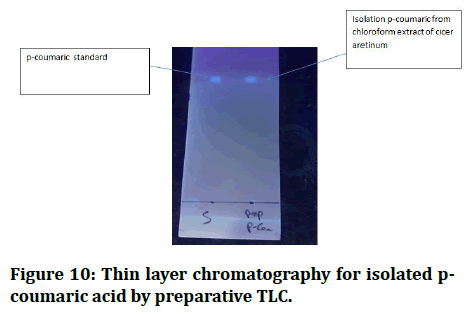
I prepared the mobile phase with toluene, ethyle acetate and formic acid (36:12:6) after activating the preparative TLC in the oven for 30 minutes [17]. I put the p-coumaric standard in the first quarter of preparative TLC, then put it in the gar and waited until it reached the front line [18]. I removed it from the gar and allowed it to dry before identifying the p-coumaric band with UV light, scratching the silca on the p-coumaric band and washing it all in methanol for one night before filtering [19]. This filter liquid is p-coumaric, which I confirmed using Thin Layer Chromatography (TLC) in the same mobile phases, the outcome is identical to that of a p-coumaric stander with the same RF value (Figures 9 and 10) [20].
Figure 9: Preparative thin layer chromatography of chloroform extract with p-coumaric acid standard.
Figure 10: Thin layer chromatography for isolated pcoumaric acid by preparative TLC.
Detection by Ultraviolet spectroscopy (UV)
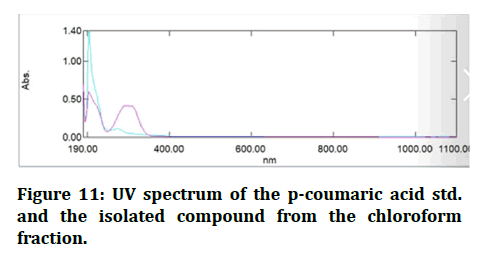
The UV spectra were taken between 200 and 800 nm and the findings demonstrated that the maximum absorbance of the isolated chemical was the same as p-coumaric measured at the same wavelength (Figure 11) [21,22].
Figure 11: UV spectrum of the p-coumaric acid std. and the isolated compound from the chloroform fraction.
Detection by Fourier Transforms Infrared (FT-IR) spectroscopy
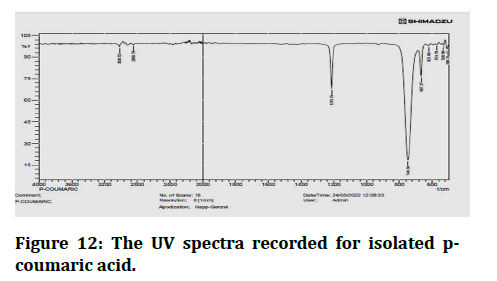
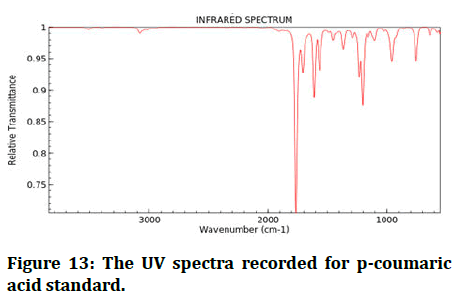
FT-IR spectroscopy is commonly used as a fingerprinting device in phytochemical research to compare a natural with a synthetic reference standard [23]. Chemical IR spectra and different IR absorption bands were distinguished as a result (Figures 12 and 13) [24].
Figure 12: The UV spectra recorded for isolated pcoumaric acid.
Figure 13: The UV spectra recorded for p-coumaric acid standard.
Conclusion
Due to its applications in phytochemical analysis, biomedical analysis, herbal drug quantification, analytical analysis, finger print analysis and HPTLC future to combinatorial approach, HPTLC-FTIR, HPTLC has grown to be a potent analytical tool in the field of analysis. In the future, more samples important to the examination of drug formulations, bulk medications, natural goods, clinical samples, food and the environment are likely to be investigated using instrumental HPTLC.
References
- Aguilera Y, Duenas M, Estrella I, et al. Phenolic profile and antioxidant capacity of chickpeas (Cicer arietinum L.) as affected by a dehydration process. Plant Foods Hum Nutr 2011; 66:187–195. [Crossref][Googlescholar][Indexed]
- Arora M, Singh S, Kaur P. Pharmacognostic and phytochemical evaluation of selected seeds of ‘Cicer arietinum’ Linn. seeds from roopnagar punab. Int J Pharm Sci Invent 2013; 2:18–29. [Googlescholar][Indexed]
- Sharma V, Singh KJ. Cytokinins initiating protective reactions in water stressed chickpea root nodules. Int J Genet Eng Biotechnol 2014; 5:115–120. [Googlescholar][Indexed]
- Pei K, Ou J, Huang J, et al. p-coumaric acid and its conjugates: Dietary sources, pharmacokinetic properties and biological activities. J Sci Food Agric 2016; 96:2952–2962. [Crossref][Googlescholar][Indexed]
- Mussatto SI, Dragone G, Roberto IC. Ferulic and p-coumaric acids extraction by alkaline hydrolysis of brewer’s spent grain. Ind Crops Prod 2007; 25:231–237. [Crossref][Googlescholar][Indexed]
- Tripathi S, Sonkar SK, Sarkar S. Growth stimulation of gram (Cicer arietinum) plant by water soluble carbon nanotubes. Nanoscale 2011; 3:1176–1181. [Crossref][Googlescholar][Indexed]
- Lasekan O, Juhari NH, Pattiram PD. Headspace solid phase micro extraction analysis of the volatile flavor compounds of roasted chickpea (Cicer arietinum L). J Food Process Technol 2011; 2. [Crossref][Googlescholar][Indexed]
- Narain K. Quantitative and qualitative changes in seeds of Cicer arietinum L. applied with distillery effluent. World Appl Sci J 2015; 33:1258-1266. [Crossref]
- Cicer L, Thakur NS, Kumar D, et al. Transient allopathic propensity of melia Composita willd. Leaf litter on chickpea (Cicer arietinum L.). Indian J Ecol 2017; 44:443-450.
- Medic Saric M, Jasprica I, Smolcic Bubalo A, et al. Optimization of chromatographic conditions in thin layer chromatography of flavonoids and phenolic acids. Croat Chem Acta 2004; 77:361–366. [Googlescholar][Indexed]
- Tanveer A, Kamran Jabbar M, Kahliq A, et al. Allelopathic effects of aqueous and organic fractions of Euphorbia dracunculoides Lam. on germination and seedling growth of chickpea and wheat. Chil J Agric Res 2012; 72:495–501. [Crossref][Googlescholar]
- Stanek N, Jasicka Misiak I. HPTLC phenolic profiles as useful tools for the authentication of honey. Food Anal Methods 2018; 11:2979–2989. [Crossref][Googlescholar][Indexed]
- ZNagara ZZ, Saour KY. Phytochemical and pharmacological study of valepotriates in Valeriana officinalis LF Valerianeceae cultivated in Iraq. Iraqi J Pharm Sci 2018; 24:1–10. [Crossref][Googlescholar][Indexed]
- Jaafar NS, Hamad MN, Abdulkhalik ZM, et al. Phytochemical investigation and High Performance Thin Layer Chromatography (HPTLC) identification of flavonoids and phenolic acids in Euphorbia cyathophora (family: Euphorbiaceae) cultivated in Iraq. Ann Trop Med Public Heal 2020; 23:232. [Crossref][Googlescholar]
- Bagde US, Prasad R, Varma A. Characterizations of culture filtrate of Piriformospora indica by HPTLC analysis. Asian J Microbiol Biotechnol Environ Sci 2010; 12:807–811.
- Ube N, Harada D, Katsuyama Y, et al. Identification of phenyl amide phytoalexins and characterization of inducible phenyl amide metabolism in wheat. Phytochemistry 2019; 167:112098. [Crossref][Googlescholar][Indexed]
- Ekiert H, Piekoszewska A, Muszynska B, et al. Accumulation of p-coumaric acid and other bioactive phenolic acids in in vitro culture of Ruta graveolens ssp. Divaricata (tenore) gams. Medicina Internacia Revuo 2014; 102:24-31. [Googlescholar][Indexed]
- Srivastava N, Khatoon S, Rawat AKS, et al. Chromatographic estimation of p-coumaric acid and triacontanol in an ayurvedic root drug patala (Stereospermum suaveolens roxb.). J Chromatogr Sci 2009; 47:936–939. [Crossref][Googlescholar][Indexed]
- Bailon TE, Fernandez YG, Juilan C, et al. Characterization of procyanidins of Vitis vinifera variety tinta del pais grape seeds. Spain. J Agric food chem 1992; 40.
- Salameh D, Brandam C, Medawar W, et al. Highlight on the problems generated by p-coumaric acid analysis in wine fermentations. Food Chem 2008; 107:1661–1667. [Crossref][Googlescholar][Indexed]
- Shaheen UY. P-coumaric acid ester with potential antioxidant activity from the genus salvia. Free Radic Antioxid 2011; 1:23–27. [Crossref][Googlescholar][Indexed]
- Holser RA. Principal component analysis of phenolic acid spectra. ISRN Spectroscopy 2012; 2012:1–5. [Crossref][Googlescholar][Indexed]
- Sadowy MK, Wislocka R, Lewandowska H, et al. Spectroscopic (FT-IR, FT-Raman, 1H- and 13C-NMR), theoretical and microbiological study of trans o-coumaric acid and alkali metal o-coumarates. Molecules 2015; 20:3146–3169. [Crossref][Googlescholar][Indexed]
- Achenbach H, Stocker M, Constenla MA. Chemical investigations of tropical medicinal plants, XXI [1] long chain alkyl esters of ferulic and p-coumaric acid from Bauhinia manca, Zeitschrift fur Naturforsch Sect. C J Biosci 1986; 41:164–168. [Crossref][Googlescholar][Indexed]
Author Info
Rawnaq Jamal Madhloom1* and Mohammed Kamil Hadi2
1Department of Pharmacognosy and Medicinal Plants, College of Pharmacy, University of Baghdad, Baghdad, Iraq2Department of Pharmaceutical Chemistry, College of Pharmacy, University of Baghdad, Baghdad, Iraq
Citation: Rawnaq Jamal Madhloom, Mohammed Kamil Hadi, Detection and Isolation of p-Coumaric Acid from Chloroform Extract of Iraqi, Cicer arietinum as well as Characterization Using Various Techniques (HPTLC, TLC, preparative TLC, UV, IR), J Res Med Dent Sci, 2023, 11(01):243-247
Received: 25-Oct-2022, Manuscript No. JRMDS-22-74584; , Pre QC No. JRMDS-22-74584 (PQ); Editor assigned: 28-Oct-2022, Pre QC No. JRMDS-22-74584 (PQ); Reviewed: 10-Dec-2022, QC No. JRMDS-22-74584; Revised: 28-Dec-2022, Manuscript No. JRMDS-22-74584 (R); Published: 11-Jan-2023

