Research - (2022) Volume 10, Issue 5
Can Measurement of Cyclic Fatigue Resistance for Titanium-Molybdenum Alloy as Rotary Endodontic Files (An In vitro Study)
Mohammad K Sabah* and Mohammed R Hammed
*Correspondence: Mohammad K Sabah, Conservative and Esthetic Dentistry Department, College of Dentistry, University of Baghdad, Iraq, Email:
Abstract
Purpose: This study aims to evaluate the cyclic fatigue resistance of Ti-Mo alloys and compare them with conventional and heat-treated NiTi alloys. Materials: Sixty new brand rotary files (EndoSequence, Endostep, 2shape, Mono2 gold, and TMA) were divided into two main groups (symmetrical and asymmetrical) according to cross-sectional designs. All samples have the same size (25/04) rotated inside the simulated stainless-steel canal. The artificial canal was (+ 0.1 mm) wider than the size of the tested instruments, (5 mm) radius of curvature, (5 mm) curvature center from the instrument tip, and (45°) angle of curvature. The time of fracture was recorded in seconds via iPhone mobile, and the number of cycles to fracture (NCF) for each file was measured. One way-ANOVA, Tukey’s HSD were performed, and statistical significance was set at P < 0.05. Results: In symmetrical groups, (NCF) value showed that EndoSequence was significantly highest cyclic fatigue resistance, followed by Endostep and TMA. While in asymmetrical groups, (NCF) value showed that Mono 2 gold was the highest cyclic fatigue resistance, followed 2 shape and TMA. Conclusion: Within the limitations of the present study, it was concluded that the cyclic fatigue resistance of NiTi rotary files was higher than Ti-Mo rotary files.
Keywords
Cyclic fatigue, Ti-Mo alloys, NiTi alloys
Introduction
Endodontic treatment includes prep of the root canal through biomechanical cleaning and shaping. Most endodontic files used to accomplish such goals are nickeltitanium (Ni-Ti) alloy. Therefore, it is essential not only to perform the thermal treatment to the Ni-Ti alloy to improve its mechanical properties but also to investigate different alloys that may have beneficial properties for the manufacture of endodontic instruments [1]. In 1979, Goldberg and Burstone introduced a beta-titanium (b-Ti) alloy into orthodontic applications. β-Ti alloy is commercially available as TMA (titanium molybdenum alloy). TMA alloy has elastic modulus under stainless steel and near nickel-titanium conventional alloy [2,3].
Field emission scanning electron microscopy (FE-SEM) is used in endodontics to characterize materials, and this technique can be coupled with a probe for chemical analysis, as energy-dispersive X-ray spectroscopy (EDX), which provides additional information about the chemical composition of the material [4].
The mechanical properties of endodontic files are also studied employing torsion and cyclic fatigue tests. The flexural fatigue is generated when the file rotates freely within a curvature, constantly developing cycles of tension (external area of the curve) and compression (internal area of the curve), thus weakening the material and generating the propagation of microcracks [5,6].
The objectives of the presented study are:
✓ To evaluate the cyclic fatigue resistance of TMA rotary files and compare them with conventional and heat-treated nickel-titanium (Ni-Ti) alloy.
✓ To evaluate if TMA rotary files promise to use to manufacture endodontic instruments in the future.
The null hypothesis was that there are no significant differences in the cyclic fatigue resistance between TMA and Ni-Ti rotary files.
Materials and Methods
Samples Preparation
The samples were prepared by using Nickel-titanium alloy and titanium molybdenum alloy. Titanium molybdenum alloy of orthodontic treatment, commonly known as β-Titanium or TMA©, was used to fabricate new TMA endodontic rotary files. The wire utilized in the study is (0.9 mm) straight cut, a round cross-section from IOS company, USA.
For the comparison with Nickel-titanium alloy, the original brand including (EndoSequence, Brasseler, USA) and (2 shapes, Micromega, France) was used, and the copy brand from a perfect company called Endostep and Mono 2 gold (China). For the standardization, all of the samples have the same size (25\04) and are divided into two cross-sectional groups:
✓ Symmetrical cross-section: include the original brand files (EndoSequence Brasseler, USA), copy brands (Endostep, perfect, China), and TMA files. The speed and torque of this group follow the original brand files (EndoSequence Brasseler, USA) at speed (500 rpm) and torque (2 Ncm).
✓ Asymmetrical cross-section: include the original brand files (2 shapes, Micromega, France), copy brands (Mono 2 gold, perfect, China), and TMA files. The speed and torque of this group follow the original brand files (2 shapes, Micromega, France) at speed (300 rpm) and torque (2.4 Ncm).
Samples Distribution
Two main groups were divided into symmetrical and asymmetrical according to the cross-section. Symmetrical cross-section divided into three subgroups: subgroup A (EndoSequence file, Brasseler, USA), subgroup B (Endostep, perfect, China), and subgroup C (β-Ti file, IOS, USA). In contrast, the asymmetrical crosssection is divided into three subgroups: subgroup D (2 shapes, Micromega, France), subgroup E (Mono 2 gold, perfect, China), and subgroup F (β-Ti file, IOS, USA) (Figure 1).
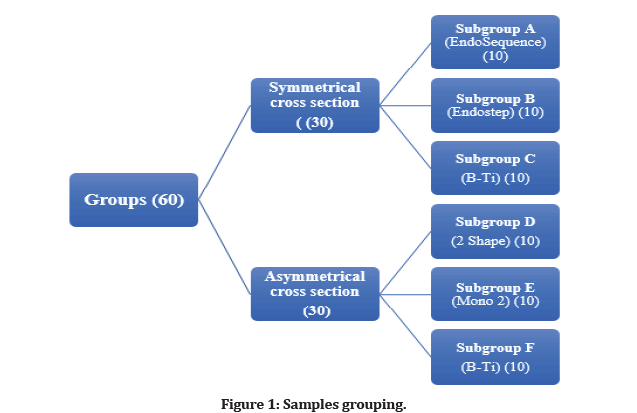
Figure 1: Samples grouping.
Cyclic Fatigue Test
Sixty new files were used in this test (ten files for each subgroup). Cyclic fatigue testing was performed with the instrument rotating freely within an artificial canal. The simulated canals were fabricated from stainless-steel blocks with dimensions (+ 0.1 mm) wider than the size of tested instruments, (5 mm) radius of curvature, (5 mm) curvature center from the instrument tip, and (45°) angle of curvature (Figure 2) [7].
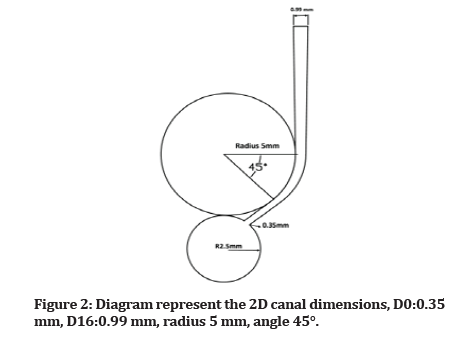
Figure 2:Diagram represent the 2D canal dimensions, D0:0.35 mm, D16:0.99 mm, radius 5 mm, angle 45°.
For the standardization, the wooden base was fabricated from the HDF wood (high-density fiberboard, Turkey) with dimension (movable part length 29 cm X width 31 cm, fixed part length 9 cm X width 31 cm). The wooden base includes two main parts; the movable part consists of the rotary handpiece (NSK, Japan) moved vertically up and down toward the fixed portion. In contrast, the fixed part includes the stainless-steel block (Figure 3).
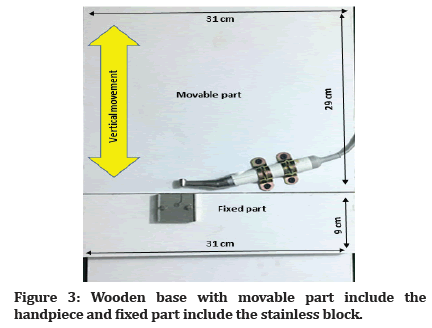
Figure 3:Wooden base with movable part include the handpiece and fixed part include the stainless block.
No pecking motion was used (static cyclic test), and no irrigation liquid was used (dry canal). During each trial, simultaneously, the motor and timer were started. The instrument was visualized through the glass until fracture occurred, and the time to fracture was recorded in seconds. To avoid human error, video recording by smartphone that fixed over the wooden base by the mobile phone holder was observed to cross-check the time of file separation (Figure 4) [7, 8].
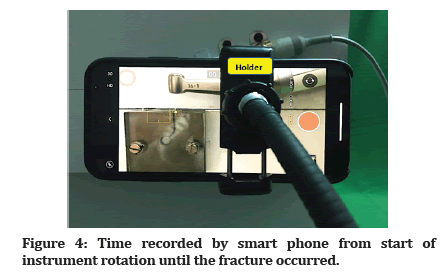
Figure 4:Time recorded by smart phone from start of instrument rotation until the fracture occurred.
The time (T) of fracture recorded in second (from starting rotation within a canal until fracture occurred), the time to fracture in seconds converted to minute by dividing on 60 and then the time in minute multiplied by the speed (revolutions per minute (RPM)) to obtain the number of cycles or rounds to fracture (NCF) for each instrument according to following (Equation 1) [9].
Equation 1: Number of cycles to fracture (NCF)=Speed (RPM) X Time (T) to fracture (seconds)/60.
The lengths of fractured fragment measured to know the location of the maximum stress points on the instruments by a digital Vernia that the end of the handle (when met handle with the shift) of the instrument on one point of Vernier and the fractured tip on the other end and the length displayed on the digital monitor of the Vernier was measured (Figure 5) and (Equation 2).
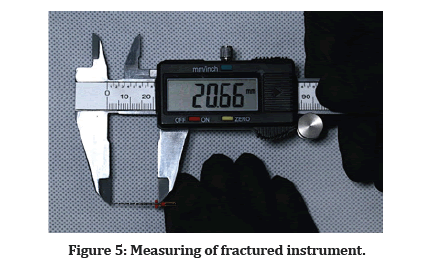
Figure 5:Measuring of fractured instrument.
Equation 2: Fractured fragment=Original length (25) – Length of the instrument after fracture.
Three fractured instruments from each subgroup were cleaned in an ultrasonic bath in absolute alcohol, and the broken surfaces were placed facing upward for fractographic examination using field emissionscanning electron microscope (FE-SEM) (Inspect F50, Netherlands) under several magnifications in order to establish the main morphological characteristics of the fracture surfaces [10].
Results
Energy dispersive x-ray spectrometry (EDS)
EDS analysis in a particular spectrum was acquired. The EDS spectrum of the new files revealed the presence of Nickel (Ni), titanium (Ti), molybdenum (Mo), zirconium (Zr%), and tin (Sn%) (Figure 6). The percentage of these elements is summarized in (Table 1).
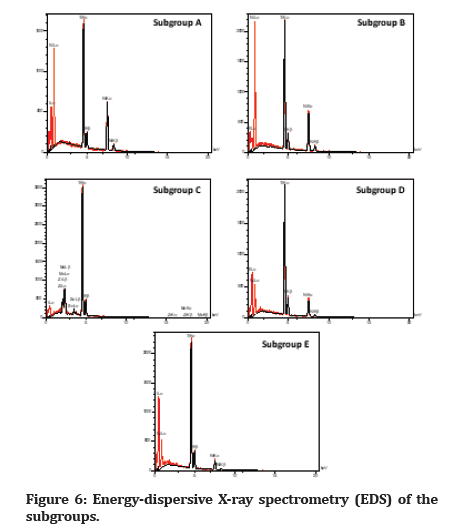
Figure 6:Energy-dispersive X-ray spectrometry (EDS) of the subgroups.
| Name | Atomic percentage % | ||||
|---|---|---|---|---|---|
| Ti | Ni | Mo | Zr | Sn | |
| Subgroup A | 41.28 | 58.72 | - | - | - |
| Subgroup B | 47.35 | 52.65 | - | - | - |
| Subgroup C | 75.59 | - | 14.5 | 4.81 | 5.09 |
| Subgroup D | 67.79 | 32.21 | - | - | - |
| Subgroup E | 77.82 | 22.18 | - | - | - |
Table 1: Atomic percentage of the elements presented in the subgroups.
Cyclic fatigue
Descriptive statistics
The descriptive statistics means and standard deviations with minimum and maximum values of TTF (in seconds), NCF, and FL (in mm) of cyclic fatigue were calculated for symmetrical and asymmetrical groups (Table 2).
| Groups | Variables | Subgroups | Mean | SD | 95% Confidence Interval for Mean | Min | Max | |
|---|---|---|---|---|---|---|---|---|
| Lower Bound | Upper Bound | |||||||
| Symmetrical | TTF (second) | A | 55.244 | 1.62314 | 54.0829 | 56.4051 | 53.11 | 57.65 |
| B | 33.155 | 1.24906 | 32.2615 | 34.0485 | 31.32 | 35.11 | ||
| C | 11.15 | 0.42203 | 10.8481 | 11.4519 | 10.71 | 11.95 | ||
| NCF | A | 460 | 13.2665 | 450.5097 | 469.4903 | 443 | 480 | |
| B | 275.9 | 10.43977 | 268.4318 | 283.3682 | 261 | 293 | ||
| C | 93 | 3.62093 | 90.4097 | 95.5903 | 89 | 100 | ||
| FL (mm) | A | 4.607 | 0.20221 | 4.4623 | 4.7517 | 4.17 | 4.83 | |
| B | 4.309 | 0.15899 | 4.1953 | 4.4227 | 4.12 | 4.55 | ||
| C | 4.698 | 0.19252 | 4.5603 | 4.8357 | 4.36 | 4.89 | ||
| Asymmetrical | TTF (second) | D | 147.9467 | 3.63643 | 145.1515 | 150.7419 | 141 | 153 |
| E | 433.645 | 36.19819 | 407.7504 | 459.5396 | 378 | 489.65 | ||
| F | 30.354 | 2.1471 | 28.8181 | 31.8899 | 27.27 | 33.75 | ||
| NCF | D | 740.1111 | 18.23763 | 726.0924 | 754.1298 | 705 | 765 | |
| E | 2168.2 | 180.948 | 2038.7576 | 2297.6424 | 1890 | 2448 | ||
| F | 151.8 | 10.73727 | 144.119 | 159.481 | 136 | 169 | ||
| FL (mm) | D | 4.5211 | 0.17353 | 4.3877 | 4.6545 | 4.18 | 4.78 | |
| E | 4.507 | 0.20287 | 4.3619 | 4.6521 | 4.2 | 4.86 | ||
| F | 4.416 | 0.17443 | 4.2912 | 4.5408 | 4.2 | 4.77 | ||
| TTF: time to fracture, NCF: number of cyclic fatigues, FL: fracture length | ||||||||
Table 2: Descriptive statistics, mean, standard deviation, maximum and minimum values of TTF (in seconds), NCF and FL (in mm) of the cyclic fatigue for the symmetrical and asymmetrical groups.
In the symmetrical cross-section groups, for TTF (in seconds) and NCF, the highest mean value was for subgroup A, and the lowest mean value was for subgroup C. While, for FL (in mm), the highest mean value was for subgroup C, and the lowest mean value was for the subgroup B (Figure 7).
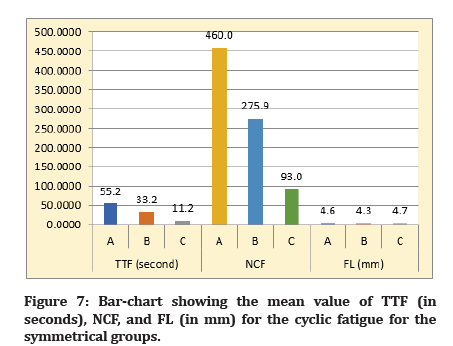
Figure 7:Bar-chart showing the mean value of TTF (in seconds), NCF, and FL (in mm) for the cyclic fatigue for the symmetrical groups.
In the asymmetrical cross-section groups, for TTF (in seconds) and NCF, the highest mean value was for subgroup E. Lowest mean value was for the subgroup F. While, for FL (in mm), the highest mean value was for subgroup D, and subgroup E and the lowest mean value was for the subgroup F (Figure 8).
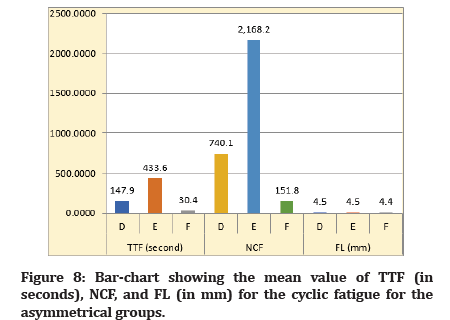
Figure 8:Bar-chart showing the mean value of TTF (in seconds), NCF, and FL (in mm) for the cyclic fatigue for the asymmetrical groups. Inferential statistics.
Comparison of the cyclic fatigue among the subgroups was made using a one-way ANOVA test at a level of significance of (0.05). ANOVA test revealed for symmetrical groups, there was a highly significant difference (p<0.01) for TTF (in seconds), NCF, and FL (in mm). While, for asymmetrical groups, there is a highly significant difference (p<0.01) for TTF, NCF, and a non-significant difference for FL (P˃0.05) (Table 3).
| Groups | Variables | Subgroups | F-test | P-value |
|---|---|---|---|---|
| Symmetrical | TTF (second) | A | 3334.692 | 0.000 (H.S) |
| B | ||||
| C | ||||
| NCF | A | 3388.699 | 0.000 (H.S) | |
| B | ||||
| C | ||||
| FL (mm) | A | 12.032 | 0.000 (H.S) | |
| B | ||||
| C | ||||
| Asymmetrical | TTF (second) | D | 933.153 | 0.000 (H.S) |
| E | ||||
| F | ||||
| NCF | D | 933.405 | 0.000 (H.S) | |
| E | ||||
| F | ||||
| FL (mm) | D | 0.932 | 0.407 (N.S) | |
| E | ||||
| F |
Table 3:One–way ANOVA test for comparison of cyclic fatigue of the symmetrical and asymmetrical groups.
Further comparison was performed using Tukey’s HSD at a level of significance of (0.05) to see where the significant difference occurred, as shown in (Table 4).
| Groups | Variables | Subgroups (I) | Mean Difference (I-J) | Sig. | 95% Confidence Interval | ||
|---|---|---|---|---|---|---|---|
| Lower Bound | Upper Bound | ||||||
| Symmetrical | TTF (second) | A | B | 22.08900* | .000 (H.S) | 20.7503 | 23.4277 |
| C | 44.09400* | .000 (H.S) | 42.7553 | 45.4327 | |||
| B | A | -22.08900* | .000 (H.S) | -23.4277 | -20.7503 | ||
| C | 22.00500* | .000 (H.S) | 20.6663 | 23.3437 | |||
| C | A | -44.09400* | .000 (H.S) | -45.4327 | -42.7553 | ||
| B | -22.00500* | .000 (H.S) | -23.3437 | -20.6663 | |||
| NCF | A | B | 184.10000* | .000 (H.S) | 173.0469 | 195.1531 | |
| C | 367.00000* | .000 (H.S) | 355.9469 | 378.0531 | |||
| B | A | -184.10000* | .000 (H.S) | -195.1531 | -173.0469 | ||
| C | 182.90000* | .000 (H.S) | 171.8469 | 193.9531 | |||
| C | A | -367.00000* | .000 (H.S) | -378.0531 | -355.9469 | ||
| B | -182.90000* | .000 (H.S) | -193.9531 | -171.8469 | |||
| FL (mm) | A | B | .29800* | .004 (S) | 0.0923 | 0.5037 | |
| C | -0.091 | .524 (N.S) | -0.2967 | 0.1147 | |||
| B | A | -.29800* | .004 (S) | -0.5037 | -0.0923 | ||
| C | -.38900* | .000 (H.S) | -0.5947 | -0.1833 | |||
| C | A | 0.091 | .524 (N.S) | -0.1147 | 0.2967 | ||
| B | .38900* | .000 (H.S) | 0.1833 | 0.5947 | |||
| Asymmetrical | TTF (second) | D | E | -285.69833* | .000 (H.S) | -310.1653 | -261.2314 |
| F | 117.59267* | .000 (H.S) | 93.1257 | 142.0596 | |||
| E | D | 285.69833* | .000 (H.S) | 261.2314 | 310.1653 | ||
| F | 403.29100* | .000 (H.S) | 379.4766 | 427.1054 | |||
| F | D | -117.59267* | .000 (H.S) | -142.0596 | -93.1257 | ||
| E | -403.29100* | .000 (H.S) | -427.1054 | -379.4766 | |||
| NCF | D | E | -1428.08889* | .000 (H.S) | -1550.3984 | -1305.7794 | |
| F | 588.31111* | .000 (H.S) | 466.0016 | 710.6206 | |||
| E | D | 1428.08889* | .000 (H.S) | 1305.7794 | 1550.3984 | ||
| F | 2016.40000* | .000 (H.S) | 1897.3527 | 2135.4473 | |||
| F | D | -588.31111* | .000 (H.S) | -710.6206 | -466.0016 | ||
| E | -2016.40000* | .000 (H.S) | -2135.4473 | -1897.3527 | |||
| FL (mm) | D | E | 0.01411 | .985 (N.S) | -0.1965 | 0.2248 | |
| F | 0.10511 | .441(N.S) | -0.1055 | 0.3158 | |||
| E | D | -0.01411 | .985 (N.S) | -0.2248 | 0.1965 | ||
| F | 0.091 | .521(N.S) | -0.114 | 0.296 | |||
| F | D | -0.10511 | .441(N.S) | -0.3158 | 0.1055 | ||
| E | -0.091 | .521(N.S) | -0.296 | 0.114 | |||
| *The mean difference is significant at the 0.05 level. | |||||||
Table 4: Tukey HSD of cyclic fatigue for the symmetrical and asymmetrical.
The results of Turkey’s HSD of cyclic fatigue show that:
Symmetrical groups:
✓ TTF and NCF: for subgroup A there is a highly significant difference in comparison to subgroups (B, C), for subgroup B, there is a highly significant difference in contrast to subgroups (A, C), and for subgroup C, there a highly significant difference in comparison to subgroups (A, B). ✓ FL: for subgroup A there is a significant difference in comparison to a subgroup (B) and a non-significant difference in contrast to a subgroup (C). For subgroup B, there is a significant difference in comparison to a subgroup (A) and a highly significant difference in comparison to a subgroup (C). For subgroup C, there is a non-significant difference in comparison to a subgroup (A) and a highly significant difference in comparison to a subgroup (B).
Asymmetrical groups:
✓TTF and NCF: for subgroup D, there is a highly significant difference in comparison to subgroups (E, F), for subgroup E, there is a highly significant difference in comparison to subgroups (D, F), and for subgroup F, there a highly significant difference in comparison to subgroups (D, E).
✓ FL: there is a non-significant difference among all subgroups.
Concerning analysis micrograph of the fracture surface, for the Ni-Ti alloy subgroups (A, B, D, E) were showing fibrous zone with flat dimples characteristics indicated of slight plastic deformation and limited ductility (a), few shear lips (b), and zone of smooth fatigue (c). On the other hand, the Ti-Mo alloy subgroups (C, F) were showing less fibrous zone with deep dimples characteristics indicated of more plastic deformation and more ductility (d), more shear lips (e), wide zone of smooth fatigue (f), and wide microcrack area (yellow dotted line) (Figure 9).
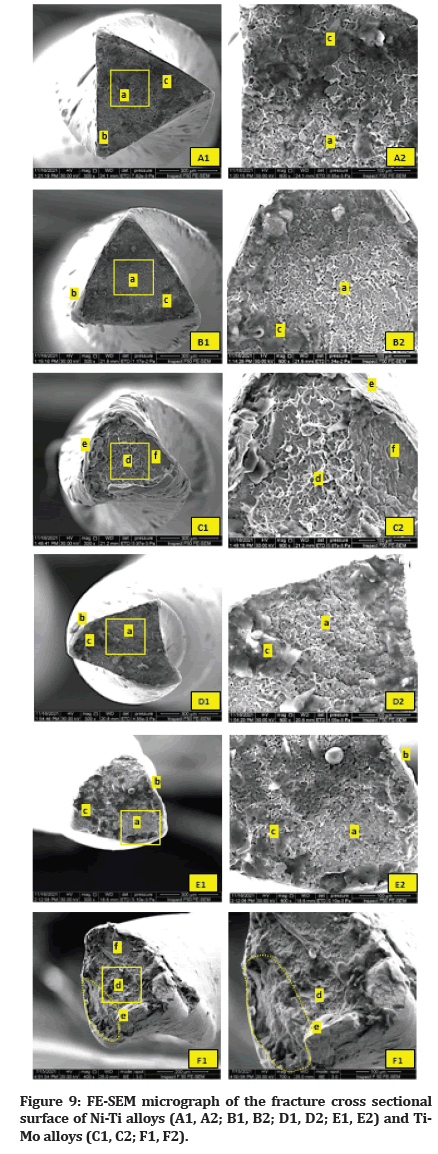
Figure 9:FE-SEM micrograph of the fracture cross sectional surface of Ni-Ti alloys (A1, A2; B1, B2; D1, D2; E1, E2) and Ti-Mo alloys (C1, C2; F1, F2).
Discussion
Cyclic fatigue resistance is affected by the diameter of the file at its maximum curvature point within an artificial canal that is designed to become (+ 0.1 mm) than instruments size (25/.04) that provide the same trajectory to all samples [11,12].
About EDS analysis, Viana, 2010, reported that the element composition of Ni-Ti alloy of endodontic files has 50.5% Ni and 49.5% Ti. However, our study found the same elements but in different percentages (Table 1); this may be attributed to other methods used in the analysis.
Goldberg and Burstone, 1979, reported the element composition of Ti-Mo-based alloy: 77.8% Ti, 11.3% Mo, 6.6% Zr, and 4.3% Sn. Our observation showed the same elements but in different amounts (Table 1); this may be because of the other method.
According to this study, the TMA rotary files (subgroups C and F) show low cyclic fatigue resistance than NiTi files in both symmetrical and asymmetrical cross-section groups. This result agrees with Nino-Barrera et al., 2021 [13].
The possible explanation may be related to the fact that the grinding process of the wire fabricated TMA files. This procedure will be created surface imperfections such as machining grooves during manufacture. The fatigue begins with crack initiation at the material surface [14].
Another cause could be related to elements compositions of TMA, as this alloy is Nickel free and has high molybdenum content according to EDS results (Table 1). Nickel improves strength and toughness via refining the grain size. It also prevents scale from forming on the material surface [15]. At the same time, the Molybdenum is one of the beta-stabilizer elements responsible for the ductility due to the body center cubic (BCC) crystal structure [16]. BCC is a minor atomic packing fraction (APF), which is less dense and stable. APF is affected on atoms slipping mechanisms, so there are more gaps between the atoms during the slipping and need enough thermal energy to bring these atoms closer. All BCC metals have a ductile-to-brittle transition temperature when there is insufficient thermal energy to activate atoms during slipping action [17].
In the presented study, the TMA files in asymmetrical groups (subgroup F) were shown high cyclic fatigue resistance than in the symmetrical group (triangular cross-section) as in subgroup C. The possible explanations may be related to speed and cross-section design. The speed used in symmetrical groups is (500 rpm) was higher than in asymmetrical groups (300 rpm). This agrees with Lopes et al., 2009; they are mentioned that cyclic fatigue resistance decreased when rotational speed increased [18]. In contrast, the cross-section affects the mass of the file and the frictional area of the file with dentinal walls. The symmetrical cross-section has significant friction contact with canal walls and less life span of the file [19]. This agrees with Hayashi et al., 2007; they were mentioned that the Ni-Ti instruments with triangular-based cross-sectional shapes displayed a higher bending load than those with rectangular-based cross-sectional conditions [20].
In symmetrical groups, subgroup A showed higher cyclic fatigue resistance than subgroup B, even though both were considered conventional NiTi alloy. This may be attributed to subgroup A (EndoSequence) having an electropolish surface that reduced the surface irregularities of machine grinding. This result agrees with Anderson et al., 2007, who show that electropolishing is likely to reduce the surface irregularities that serve as points for stress concentration and crack initiation [21]. Also, this result has disagreed with Herold et al., 2007, showing that the file design and electropolishing did not inhibit the development of microfractures in EndoSequence rotary files [22].
In asymmetrical groups, subgroup E showed higher cyclic fatigue resistance than subgroup D, even though both were considered heat-treated NiTi alloy. The possible explanation may be related to the different degrees of heat treatment that may be affected the degree of the instrument's flexibility. This agrees with Thompson, 2000; he was stated that it adjusts the transition temperature in NiTi alloy by the heat treatment or thermal processing, improving the flexibility and fatigue resistance of NiTi endodontic files [23].
The FE-SEM analysis to cross-section view of fracture area showed fibrous zone with flat dimples features with limited ductility for NiTi alloy subgroups. TMA subgroups showed fewer fibrous zones with deep dimples characteristics and more ductility features. These results were agreed with Nino-Barrera et al., 2021 [13].
Further studies were required to examine Ti-Mo alloy with different elemental composition percentages. This study examined the TMA sample with the following elements: Ti 75.59%, Mo 14.50%, Zr 4.81%, and Sn 5.09%. Also, this study was restricted to simulated stainless-steel canals. This excludes the natural intracanal condition such as debris, body temperature, and complex root canal morphology that affected mechanical properties on working the rotary instruments. Different surface treatments such as electro polish or adding other elements could be enhanced this kind of alloy for future possibilities to be introduced in endodontic rotary files.
Conclusion
According to the results of the present investigation, the null hypothesis was rejected because the TMA rotary files have lower cyclic fatigue resistance when compared with NiTi rotary files. TMA files show enhanced mechanical properties when controlling speed and torque values during the canal prep and changing the cross-sectional design. Electro polishing was increased fatigue resistance via reduced surface grinding imperfections. Heat surface treatment improved fatigue resistance by affecting the flexibility of the file.
References
- Lopes HP, Gambarra-Soares T, Elias CN, et al. Comparison of the mechanical properties of rotary instruments made of conventional nickel-titanium wire, M-wire, or nickel-titanium alloy in R-phase. J Endod. 2013;39(4):516-20.
- Burstone CJ, Goldberg AJ. Beta titanium: a new orthodontic alloy. Am J Orthod. 1980;77(2):121-32..
- Kusy RP, Whitley JQ. Thermal and mechanical characteristics of stainless steel, titanium-molybdenum, and nickel-titanium archwires. Am J Orthod Dentofacial Orthop. 2007;131(2):229-37.
- Shen YA, Cheung GS. Methods and models to study nickel–titanium instruments. Endod Topics 2013;29:18-41.
- Kaval ME, Capar ID, Ertas H. Evaluation of the cyclic fatigue and torsional resistance of novel nickel-titanium rotary files with various alloy properties. J Endod. 2016;42(12):1840-3.
- Rodrigues RC, Lopes HP, Elias CN, et al. Influence of different manufacturing methods on the cyclic fatigue of rotary nickel-titanium endodontic instruments. J Endod. 2011;37(11):1553-7.
- Alqedairi A, Alfawaz H, Bin Rabba A, et al. Failure analysis and reliability of Ni–Ti-based dental rotary files subjected to cyclic fatigue. Metals. 2018 Jan;8(1):36.
- Pedullà E, Grande NM, Plotino G, et al. Influence of continuous or reciprocating motion on cyclic fatigue resistance of 4 different nickel-titanium rotary instruments. J Endod. 2013;39(2):258-61.
- Gambarini G, Grande NM, Plotino G, et al. Fatigue resistance of engine-driven rotary nickel-titanium instruments produced by new manufacturing methods. J Endod. 2008;34(8):1003-5.
- Keleş AH, Eymirli AY, Uyanık O, et al. Influence of static and dynamic cyclic fatigue tests on the lifespan of four reciprocating systems at different temperatures. Int Endod J. 2019;52(6):880-6.
- Grande NM, Plotino G, Silla E, et al. Environmental temperature drastically affects flexural fatigue resistance of nickel-titanium rotary files. J Endod. 2017;43(7):1157-60.
- Grande NM, Plotino G, Pecci R, et al. Cyclic fatigue resistance and three‐dimensional analysis of instruments from two nickel–titanium rotary systems. Int Endod J. 2006;39(10):755-63.
- Nino-Barrera JL, Aldana-Ojeda L, Gamboa-Martinez LF, et al. Comparison of mechanical and structural properties of nickel-titanium alloy with titanium-molybdenum alloy and titanium-niobium alloy as potential metals for endodontic files.
- Cheung GS. Instrument fracture: Mechanisms, removal of fragments, and clinical outcomes. Endod Topics 2007; 16:1-26.
- Tracey V. Nickel sintered steels—Developments, status and prospects. Met Powder Rep 1992; 47:49.
- Froes FH, Bomberger HB. The beta titanium alloys. JOM 1985; 37:28-37.
- Callister Jr WD, Rethwisch DG. Fundamentals of materials science and engineering: an integrated approach. Structures of Metals and Ceramics: John Wiley & Sons; 2020.
- Lopes HP, Ferreira AA, Elias CN, et al. Influence of rotational speed on the cyclic fatigue of rotary nickel-titanium endodontic instruments. J Endod 2009; 35:1013-6.
- Roulet JF. Dynamic fracture of conventional endodontic instruments versus experimental files. J Endod 1983; 9:12-6.
- Hayashi Y, Yoneyama T, Yahata Y, et al. Phase transformation behaviour and bending properties of hybrid nickel–titanium rotary endodontic instruments. Int Endod J 2007; 40:247-53.
- Anderson ME, Price JW, Parashos P. Fracture resistance of electropolished rotary nickel–titanium endodontic instruments. J Endod 2007; 33:1212-6.
- Herold KS, Johnson BR, Wenckus CS. A scanning electron microscopy evaluation of microfractures, deformation and separation in EndoSequence and Profile nickel-titanium rotary files using an extracted molar tooth model. J Endod 2007; 33:712-4.
- Thompson SA. An overview of nickel–titanium alloys used in dentistry. Int Endod J 2000; 33:297-310.
Indexed at, Google Scholar, Cross Ref
Indexed at, Google Scholar, Cross Ref
Indexed at, Google Scholar, Cross Ref
Indexed at, Google Scholar, Cross Ref
Indexed at, Google Scholar, Cross Ref
Indexed at, Google Scholar, Cross Ref
Indexed at, Google Scholar, Cross Ref
Indexed at, Google Scholar, Cross Ref
Indexed at, Google Scholar, Cross Ref
Indexed at, Google Scholar, Cross Ref
Indexed at, Google Scholar, Cross Ref
Indexed at, Google Scholar, Cross Ref
Indexed at, Google Scholar, Cross Ref
Indexed at, Google Scholar, Cross Ref
Indexed at, Google Scholar, Cross Ref
Indexed at, Google Scholar, Cross Ref
Indexed at, Google Scholar, Cross Ref
Indexed at, Google Scholar, Cross Ref
Indexed at, Google Scholar, Cross Ref
Indexed at, Google Scholar, Cross Ref
Author Info
Mohammad K Sabah* and Mohammed R Hammed
Conservative and Esthetic Dentistry Department, College of Dentistry, University of Baghdad, IraqCitation: Mohammad K Sabah, Mohammed R Hammed, Can Measurement of Cyclic Fatigue Resistance for Titanium-Molybdenum Alloy as Rotary Endodontic Files (An In vitro Study), J Res Med Dent Sci, 2022, 10 (5): 116-123
Received: 28-Apr-2022, Manuscript No. JRMDS-22-62396; , Pre QC No. JRMDS-22-62396 (PQ); Editor assigned: 30-Apr-2022, Pre QC No. JRMDS-22-62396 (PQ); Reviewed: 14-May-2022, QC No. JRMDS-22-62396; Revised: 19-May-2022, Manuscript No. JRMDS-22-62396 (R); Published: 26-May-2022
