Research - (2021) Volume 9, Issue 1
Awareness on Road Traffic Accidents Among College Students
Keerthana B, Vishnu Priya V* and Gayathri R
*Correspondence: Vishnu Priya V, Department of Biochemistry, Saveetha Dental College and Hospitals, Saveetha Institute of Medical and Technical Sciences, Saveetha University Tamilnadu, India, Email:
Abstract
Road traffic accidents is a worldwide issue which should be considered because most of the road traffic accidents are caused by the younger generation. The saddest part is that India stands in the 5th position worldwide in road traffic accidents. The death toll is a higher side for the countries where pedestrians, two-wheelers and passengers are vulnerable and lacks traffic signal ethics. The highest burden of injuries and fatalities is borne disproportionately by poor people, as they are mostly pedestrians, cyclists, and passengers of buses and minibuses. The aim of this study is to create awareness on road traffic accidents among college students. Self-structured questionnaire was designed based on awareness of road traffic accidents among college students. The questionnaire was distributed through an online survey planet link and the study population included 100 college students. The data was collected and statistically analysed. From the study, the knowledge that is gained is about 97% of college students were aware of road traffic accidents. From this study we may conclude that more awareness camps, seminars may be conducted in educational institutions regarding safety precautions in road, traffic rules, speeding on road, drunken driving, using mobile phones while driving and risks of road traffic accidents.
Keywords
Traffic, Accidents, Awareness, College students, Survey planet
Introduction
Road accidents in the nation can be fatal or nonfatal injuries incurred because of road traffic crashes [1]. Road accidents are ninth leading in the cause of deaths and surveys say it may become 5th position by the year 2020. Globally road traffic accidents are the leading cause of death to young people aged 16-21. However, the saddest part is they belong to the next generation and college students [2]. The death toll is a higher side for the countries where pedestrians, two-wheelers and passengers are vulnerable and lacks traffic ethics. According to WHO 1.25 million deaths happen in a year in road traffic accidents worldwide. The United Nations has rightly proclaimed 2011-20 as the Decade of Action on Road Safety. India is a signatory to Brasilia Declaration and is committed to reducing the number of road accidents and fatalities up to 50 per cent by 2020 [3]. Simple measures like awareness and practice of road safety measures can effectively reduce the impact of RTAs on the lives of people [4]. There are possibilities in reducing road traffic accidents by increasing level of awareness and studying the behaviour pattern while using motorized vehicles among the study population [5]. The death rate is increasing in the population of the age group 15- 20 in the national bureau [6].
The importance of knowledge and practice of road safety measures needs to be emphasized in the prevention of RTAs. Child pedestrian injury, an important cause of morbidity and mortality remains one of the leading causes of death in developed and developing countries [7]. Each year in the US approximately 850 children under the age of 15 years are killed & another 30000 are injured in pedestrian crashes [8]. Road safety is a complex process that not only depends on technical and environmental improvements but in a major part from human factors [9]. They are the leading cause of death among young people aged between 15 and 29 years globally. In the South-East Asian region of the World Health Organization, India alone accounted for 73 per cent of these Road traffic accidents (RTA) burden [10]. The highest burden of injuries and fatalities is borne disproportionately by poor people, as they are mostly pedestrians, cyclists, and passengers of buses and minibuses. The previous studies also noted that the problem of road traffic accidents was most severe in developing countries and that simple preventive measures could have a higher number of deaths [11-13]. Some studies state that road accidents are also caused by mental stress and falling asleep, which can also be a major component in road accidents [14-16]. Previous studies reported the level of awareness that drivers have on law and order of non-compliant. It also reported that age and attitude are associated with the exposure to accidents [1]. Previous studies on cancer biology, nano materials, herbal products. A study reported most secondary school students had average awareness and education and strict rules needed to create more awareness and motivate them to reduce morbidity and mortality due to road traffic accidents [3]. Road traffic injury prevention must be incorporated into a broad range of activities, such as the development and management of road infrastructure, the provision of safer vehicles, law enforcement, mobility planning, the provision of health and hospital services, child welfare services, and urban and environmental planning [17,18]. Previous studies on cancer biology, nano materials, herbal products [19- 23] have motivated me to pursue this current research which is useful to our community. The aim of the study is to create awareness on road traffic accidents among college students.
Materials and Methods
Self-structured questionnaire was designed based on awareness of road traffic accidents among college students. The questionnaire was distributed through an online survey planet link to the study population which included 100 students. The participants were explained about the purpose of study in detail. The questions where carefully studied, and the corresponding answers were marked by the participants. The data was collected and statistically analysed.
Results and Discussion
The survey was administered through an online survey planet link to college students in the age group of 18-21 years and 100 responses were seen. 96% agreed that they were aware of traffic signal ethics and 4% disagreed (Figure 1). In the previous research [4] the level of awareness was 74%. 79% agreed that they wore helmets while driving and 21% said that they did not wear helmets (Figure 2). 83.7% agreed that they wore seat belts while driving a car and 16% disagreed with it (Figure 3). Previous studies reported 81% awareness about helmets and seat belts [4].
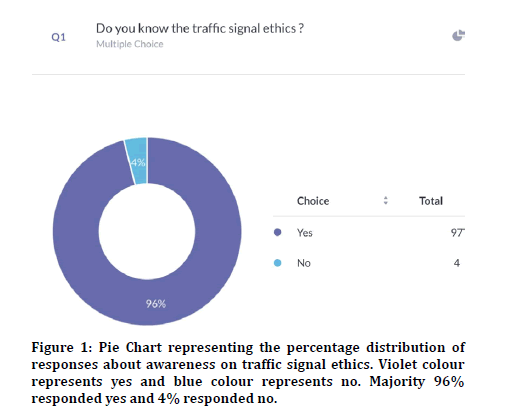
Figure 1: Pie Chart representing the percentage distribution of responses about awareness on traffic signal ethics. Violet colour represents yes and blue colour represents no. Majority 96% responded yes and 4% responded no.
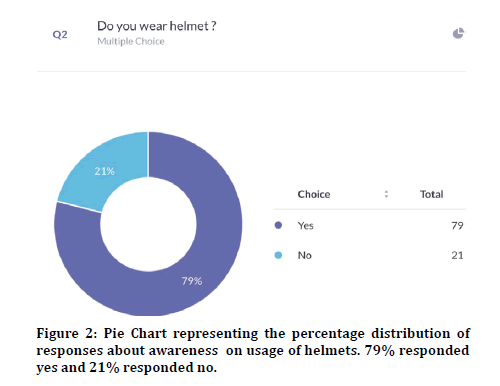
Figure 2: Pie Chart representing the percentage distribution of responses about awareness on usage of helmets. 79% responded yes and 21% responded no.
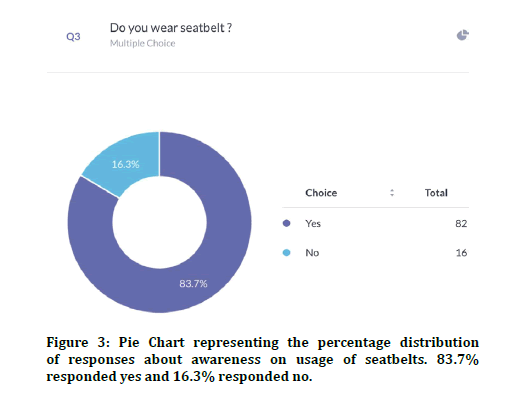
Figure 3: Pie Chart representing the percentage distributio n of responses about awareness on usage of seatbelts. 83.7% responded yes and 16.3% responded no.
66% of participants had a driving license and 34% did not have a driving license (Figure 4). 87.9% of the participants were aware about the speed limit on the road and 12.1% were unaware about the speed limit (Figure 5). Previous studies explained the speed limit as an important factor in road traffic accidents [13]. 75% agreed that the severity of injuries can be reduced if speed was 10km/hr 25% disagreed (Figure 6). 95.9% agreed that they were aware of drunken driving 4% were unaware about drunk driving (Figure 7). Previous studies showed the importance of alcohol and drugs in road accidents [12,24].
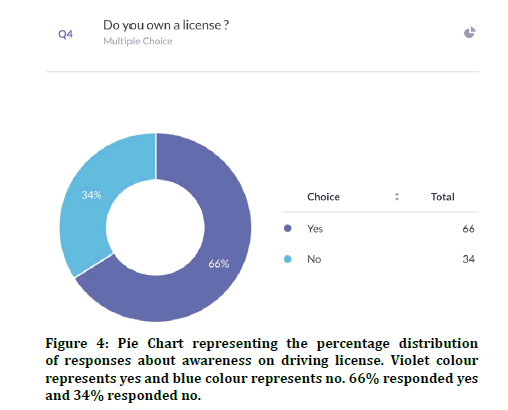
Figure 4: Pie Chart representing the percentage distribution of responses about awareness on driving license. Violet colour represents yes and blue colour represents no. 66% responded yes and 34% responded no.
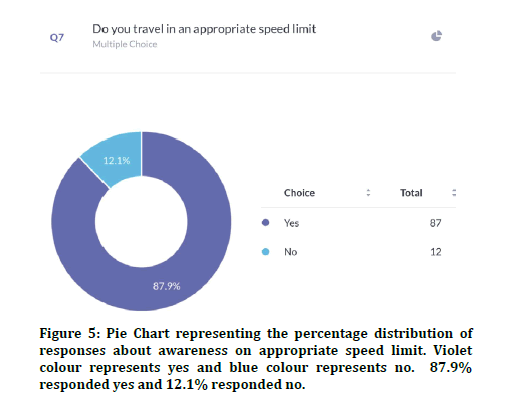
Figure 5: Pie Chart representing the percentage distribution of responses about awareness on appropriate speed limit. Violet colour represents yes and blue colour represents no. 87.9% responded yes and 12.1% responded no.
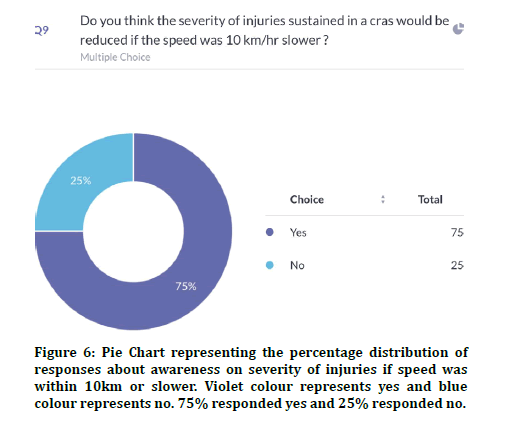
Figure 6: Pie Chart representing the percentage distribution of responses about awareness on severity of injuries if speed was within 10km or slower. Violet colour represents yes and blue colour represents no. 75% responded yes and 25% responded no.
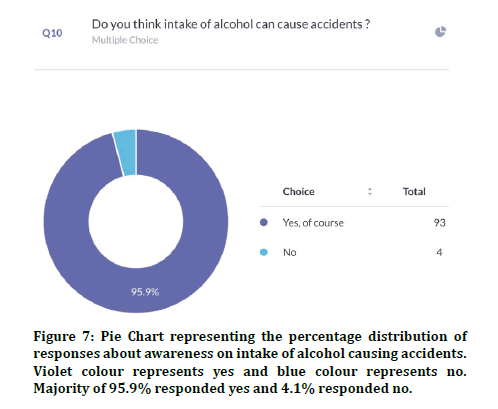
Figure 7: Pie Chart representing the percentage distribution of responses about awareness on intake of alcohol causing accidents. Violet colour represents yes and blue colour represents no. Majority of 95.9% responded yes and 4.1% responded no.
76.3% agreed that random breath testing could make accidents happen less (Figure 8). 72.3% agreed that their family members were involved in accidents and 27.7% disagreed (Figure 9). Previous study states that climatic conditions due have an impact on road accidents [25]. 85% responded that indicators were used properly and 15% responded that indicators were not used in appropriate places (Figure 10). 88.9% agreed that overcrowding in the vehicle can lead to accidents and 11.1% disagreed (Figure 11). Previous study discussed crowding and its causes in accidents [26]. The next question when asked the reason for driving vehicles too fast. There was a mixed response of 41.6% for fun, 35.6% for style and the rest 22.8% for going to college on time (Figure 12). 94% agreed that driver’s lack of sleep will cause road accidents and 6% disagreed (Figure 13). Previous studies have discussed sleep and road accidents due to it [14-16]. 96% agreed that there is the ability to change society by reducing road accidents (Figure 14).
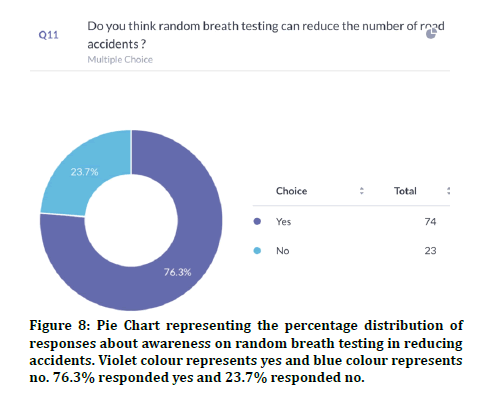
Figure 8: Pie Chart representing the percentage distribution of responses about awareness on random breath testing in reducing accidents. Violet colour represents yes and blue colour represents no. 76.3% responded yes and 23.7% responded no.
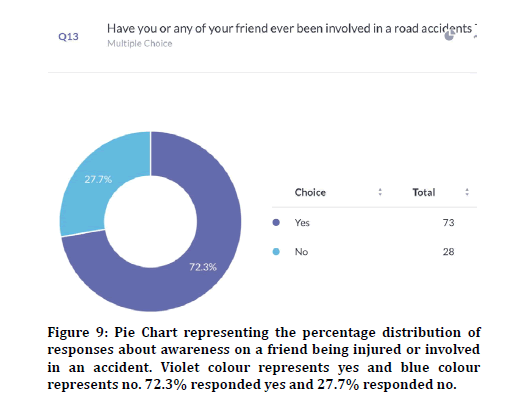
Figure 9: Pie Chart representing the percentage distribution of responses about awareness on a friend being injured or involved in an accident. Violet colour represents yes and blue colour represents no. 72.3% responded yes and 27.7% responded no.
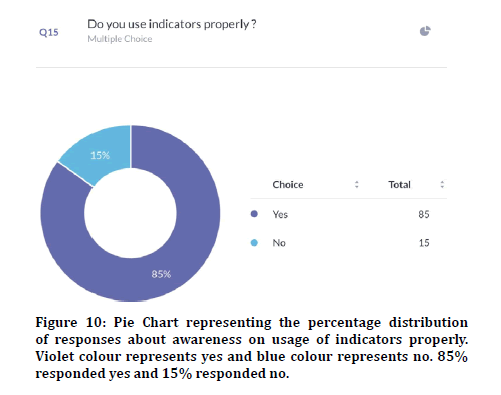
Figure 10: Pie Chart representing the percentage distribution of responses about awareness on usage of indicators properly. Violet colour represents yes and blue colour represents no. 85% responded yes and 15% responded no.
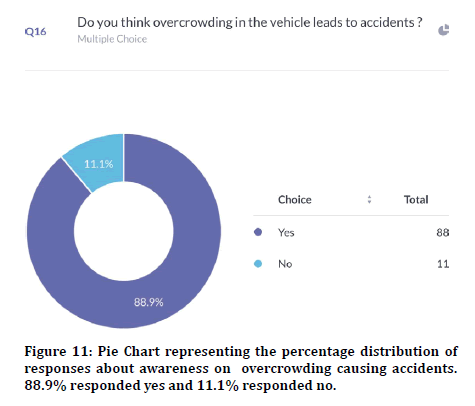
Figure 11: Pie Chart representing the percentage distribution of responses about awareness on overcrowding causing accidents. 88.9% responded yes and 11.1% responded no.
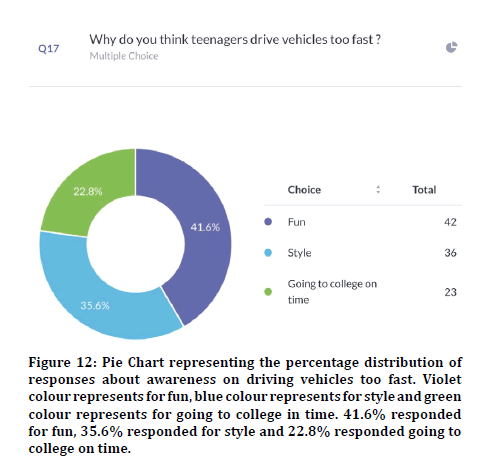
Figure 12: Pie Chart representing the percentage distribution of responses about awareness on driving vehicles too fast. Violet colour represents for fun, blue colour represents for style and green colour represents for going to college in time. 41.6% responded for fun, 35.6% responded for style and 22.8% responded going to college on time.
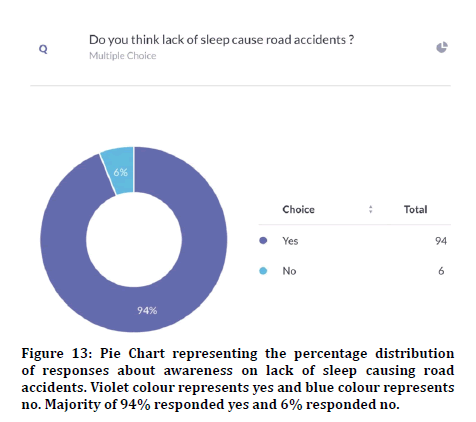
Figure 13: Pie Chart representing the percentage distribution of responses about awareness on lack of sleep causing road accidents. Violet colour represents yes and blue colour represents no. Majority of 94% responded yes and 6% responded no.
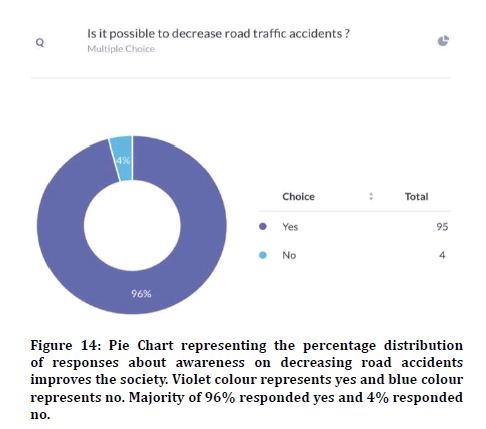
Figure 14: Pie Chart representing the percentage distribution of responses about awareness on decreasing road accidents improves the society. Violet colour represents yes and blue colour represents no. Majority of 96% responded yes and 4% responded no.
Conclusion
Road traffic accidents are a major thing to be concerned about because it affects the younger generation. From this study we may conclude that more awareness camps, seminars may be conducted in educational institutions regarding safety precautions in road, traffic rules, speeding on road, drunken driving, using mobile phones while driving and risks of road traffic accidents.
Acknowledgement
We thank Saveetha Dental College for providing us the support to complete the study.
Conflict of Interest
Nil.
References
- Redhwan AA, Karim AJ. Knowledge, attitude, and practice towards road traffic regulations among university students, Malaysia. Med J Malaysia 2010; 9.
- Singh M. Awareness and practice of road safety rules among secondary school students in Jaipur, Rajasthan. J Health Allied Sc 2018; 8:25–31.
- Peden M. World report on road traffic injury prevention: Summary. DIANE Publishing 2008.
- Zaidi SH, Paul PC, Mishra P, et al. Risk perception and practice towards road traffic safety among medical students. Int J Community Med Public Health 2017; 4:9-14.
- Peden M, Scurfield R, Sleet D, et al. World report on road traffic injury prevention. World Health Organization 2004.
- Kulkarni V, Kanchan T, Palanivel C, et al. Awareness and practice of road safety measures among undergraduate medical students in a South Indian state. J Forensic Legal Med 2013; 20:226–229.
- Alonso F, Esteban C, Montoro L, et al. Knowledge, perceived effectiveness and qualification of traffic rules, police supervision, sanctions and justice. Cogent Social Sci 2017; 3: 1393855.
- Thirunavukkarasu A, Alruwaili SH, Alkuwaikibi BS, et al. Knowledge and practices of road safety measures among Jouf University students: A cross-sectional study. Aljouf University Med J 2018; 300:1-8.
- Haasper C, Otte D, Knobloch K, et al. Knee injuries in restrained car drivers in German road traffic accidents. J Trauma 2008; 65:136–141.
- Gopalakrishnan S. A public health perspective of road traffic accidents. J Family Med Primary Care 2012; 1:144.
- Ruikar M. National statistics of road traffic accidents in India. J Orthop Traumatol Rehab 2013; 6:1.
- Ricci G, Majori S, Mantovani W, et al. Prevalence of alcohol and drugs in urine of patients involved in road accidents. J Preventive Med Hygiene 2008; 49:89–95.
- McDermott FT. Prevention of road accidents in Australia. Pediatrician 1983; 12:41–45.
- Sagberg F. Road accidents caused by drivers falling asleep. Accident Analysis Prevention 1999; 31:639–649.
- Blanchard EB, Veazey CH. Mental disorders resulting from road traffic accidents. Current Opinion Psychiatry 2001; 4:143.
- Garbarino S, Magnavita N, Guglielmi O, et al. Insomnia is associated with road accidents. Further evidence from a study on truck drivers. PloS One 2017; 12:e0187256.
- Morales A, Sánchez-Aparicio LJ, González-Aguilera D, et al. A new approach to energy calculation of road accidents against fixed small section elements based on close-range photogrammetry. Remote Sensing 2017; 9:1219.
- Murat JE. Road vehicle accidents during travel and their prevention. Med Tropicale 1997; 57:522–526.
- Wu F, Zhu J, Li G, et al. Biologically synthesized green gold nanoparticles from Siberian ginseng induce growth-inhibitory effect on melanoma cells (B16). Artificial Cells Nanomed Biotechnol 2019; 47:3297-305.
- Ke Y, Al Aboody MS, Alturaiki W, et al. Photosynthesized gold nanoparticles from Catharanthus roseus induces caspase-mediated apoptosis in cervical cancer cells (HeLa). Artificial Cells Nanomed Biotechnol 2019; 47:1938–1946.
- Ma Y, Karunakaran T, Veeraraghavan VP, et al. Sesame inhibits cell proliferation and induces apoptosis through inhibition of STAT-3 translocation in thyroid cancer cell lines (FTC-133). Biotechnol Bioprocess Engineering 2019; 24:646–652.
- Wang Y, Zhang Y, Guo Y, et al. Synthesis of zinc oxide nanoparticles from Marsdenia tenacissima inhibits the cell proliferation and induces apoptosis in laryngeal cancer cells (Hep-2). J Photochem Photobiol 2019; 201:111624.
- GR RG, V VP GR. Cytotoxicity of strawberry extract on oral cancer cell line. Asian J Pharm Clin Res 2018; 353.
- Merlin G, Lepoittevin L, Turcant A, et al. Responsibility of psychotropic drugs in road accidents. Presse Med 1991; 20:409–412.
- Jaroszweski D, McNamara T. The influence of rainfall on road accidents in urban areas: A weather radar approach. Travel Behaviour Society 2014; 1:15–21.
- Tingvall C. Children in cars. Some aspects of the safety of children as car passengers in road traffic accidents. Acta Paediatr Scandinavica. Supplement 1987; 339:1–35.
Author Info
Keerthana B, Vishnu Priya V* and Gayathri R
Department of Biochemistry, Saveetha Dental College and Hospitals, Saveetha Institute of Medical and Technical Sciences, Saveetha University Tamilnadu, Chennai, IndiaCitation: Keerthana B, Vishnu Priya V, Gayathri R, Awareness on Road Traffic Accidents Among College Students, J Res Med Dent Sci, 2021, 9 (1): 81-86.
Received: 23-Sep-2020 Accepted: 11-Dec-2020
